



FILTERED RESULTS
FILTERS
MCap $2.9T -0.1%24h Vol $109.2B -30%Fear & Greed 71/100Alts Index 57/100
BTC.D 58.5% +0.2%Stable.D 9.3% +0.1%ETH.D 11.4% 0%Others.D 20.8% -0.3%
SOON$0.4364+47.16%•ZBCN$0.00278825+29.74%•ZRO$1.850+21.1%•QNT$283.90+17.93%•PUMP$0.00574361+16.58%•KSM$5.264+14.79%•NIGHT$0.0320+14.23%•CAP$0.0614+10.59%•FF$0.1288+10.4%•ETHFI$0.7674+10.24%•
LIT$3.772-13.05%•HBAR$0.1045-12.39%•AI$0.1982-9.26%•BR$0.8281-8.92%•ALGO$0.1239-7.16%•MARSCOIN$0.1464-6.5%•ZAMA$0.0736-6.12%•BTW$1.302-6.08%•Q$0.0235-5.94%•IOTA$0.0521-5.81%•
•
·
·
FILTERED RESULTS
PhotonPay Partners with DFNS to Upgrade Global Trade Payment Network
PhotonPay and DFNS Join Forces to Advance Stablecoin Payments for Global Commerce
Robinhood announces AI agent for customers that trades around the clock, plus 10x crypto perps
First NEAR Spot ETF Goes Live in the US
Morgan Stanley Sets Up Lab to Test Stablecoins,…
Binance Pay Expands to PayPay Merchants Across Japan
Coinbase Receives CFTC Approval to Operate Its Own Crypto…
Consensys founder: MetaMask is evaluating various paths for issuing a token, but there are currently no concrete plans
HSBC, Hong Kong’s Largest Bank, Names Stablecoin ‘RedCoin’HSBC, Hong Kong’s largest bank and one of...
Brazil's CSD BR Begins Recording Fund Ownership on XRP Ledger
Binance announced Wednesday that Binance Pay users can now make payments at Japanese
Coinbase Plans Digital Pokémon Pulls With Real Cards Behind Them
HSBC names its upcoming Hong Kong stablecoin "HSBC RedCoin"
XRP Ledger starts carrying fund records from Brazil operator overseeing $4 trillion
Brazilian depository CSD BR has partnered with Ripple to tokenize and mirror BTG Pactual
MetaMask Evaluates Token Issuance, No Immediate Plans for Launch
Tom Lee Predicts Largest Bull Market Cycle at Korea Blockchain Week
Bitget has achieved net capital inflow, with a net inflow of $9.47 million all day yesterday
Arthur Hayes: ETH Expected to Reach $10,000 by End of Year
SlowMist: Bitget theft can be traced back to August 31, involving a zero-day vulnerability in a third-party product
Apple Patches iOS Flaw That Could Let Attackers Run Malicious Code on iPhones
Bitget USDT Withdrawals Due Sept 30 After Record $463M Outflow, Reserves at 131%
eCash Price Prediction 2026, 2027 – 2030: Will XEC Price Record 2X Surge?
Ripple No Longer Member of BIS Cross-Border Payments Task Force
Bitcoin rally shows signs of cooling even as a 'bull score' gauge nears its perfect score
Pump.fun Introduces Near-Zero-Fee Trading App for Token Distribution
Illinois draft crypto tax rules detail DeFi, stablecoin treatment
Bitcoin Up 43.1% In Q3 2026, Best Quarterly Performance Since 2024
XRP News Today: Community Asks Why Ripple’s Brazil Deal Isn’t Lifting The XRP Price
Bitcoin ETFs Draw $66 Million Inflows, Ether Funds Post Small OutflowU.S. spot Bitcoin ETFs...
Cathie Wood's Ark Invest bought $2.5 million worth of Block Inc shares $XYZ on Tuesday
Banker Turned on Clients, Routing $932K to Coinbase for $1K+
MAX Exchange in Taiwan Launches Native Tether USDT Support for Local Traders
$CT listed on OKX spot・
China Dominates Global Humanoid Robot Shipments in 2026
Zcash Awards $1.5 Million to Vulnerability Discoverer
Binance Alpha to First List Concrete (CT) on September 30
ConsenSys CEO Joe Lubin said at Korea Blockchain Week 2026 that team is evaluating
Ethereum Spot ETF Saw Net Outflow of $2.8086 Million Yesterday, BlackRock ETHA Led with $8.9408 Million Net Outflow
Bitcoin spot ETFs saw net inflows of $66.1947 million yesterday, marking 9 consecutive days of net inflows
RootData Partners with South Korean Exchange Coinone for Enhanced Market Research
Samsung Electronics Projects HBM to Reach 30% of DRAM Wafer Production Capacity in 2027
Bitdeer Reports Significant Net Loss in First Half of 2026
Goatseus Maximus (GOAT) Price Prediction 2026, 2027-2030
Illinois to Tax Crypto Trades 0.2%—Even on Losing Trades
Celo (CELO) Price Prediction 2026, 2027-2030: Is Now the Best Time to Accumulate CELO?
Institutions: China's humanoid robot shipments exceeded 19,000 units in H1, accounting for about 77.9% of the global total
Cathie Wood's Ark Invest now holds direct exposure to Kalshi through $ARKK , $ARKW , and
Binance Will Add 7 bStocks Tokenized Securities as Collateral Asset - 2026-09-30Binance Cross Margin...
SlowMist: Suspected North Korean Hackers Route Stolen Bitget Funds Through CoW, ChainflipSlowMist...
SBI, Mesh, Money Forward Plan Japan JV for Crypto Connectivity, Stablecoin Payments
UK Orders Crypto Fraudsters to Repay £851,402 to Scam Victims
Binance to List ADBEB, FWDIB and Other bStocks Spot Trading Pairs
Hyperliquid co-founder Jeff Yan said at Korea Blockchain Week 2026 that he sees a "big
Binance Exchange Adds Adobe (ADBEB), Forward Industries (FWDIB), Hewlett Packard (HPEB), PDD Holding...
SlowMist's Cos: North Korean hackers use Cow and Chainflip combo for cross-chain, automated scripts move stolen Bitget funds into BTC
South Korean opposition party calls for review of virtual asset taxation, urging postponement or abolition of crypto tax set for January next year
Bitmine Chairman Tom Lee said at Korea Blockchain Week 2026 that upcoming bull
Whales are buying $AAVE!Two wallets swapped 50.95 $WBTC($4.26M) for 25,502 $AAVE...
US SOL spot ETFs see single-day net inflow of $5.438 million
Abracadabra launches proposal vote to shut down the protocol and liquidate MIM
SEC Charges WhatsApp Crypto AI Scams Allegedly Taking Over $15.3M
619 $BTC (51,629,550 USD) transferred from Coinbase Institutional to unknown wallet...
XRP Price: Can Bulls Push XRP Above $1.60 This Week?
Binance Pay Integrates with PayPay to Allow USDT Spending in Japan
Bitdeer reports H1 revenue of $417.7 million and net loss of $251.8 million
Trader Killa: Market's expected deep pullback may not materialize, still bullish on Bitcoin toward the $90,000 range
Maelstrom CIO Arthur Hayes said at Korea Blockchain Week 2026 that no digital currency —
Abracadabra Proposes Liquidation Agreement for MIM Stablecoin Holders
Bitcoin Closed the Month Up Nearly 25%, While Ethereum Gained 32%


- In August, bitcoin and Ethereum posted gains.
- In bitcoin’s case, it is the best monthly performance since November 2025.
- Both assets reacted positively to a shift in regulatory rhetoric and the U.S. Treasury’s decision to increase bond buybacks.
August was positive for both bitcoin and Ethereum. The gains for these assets came in at 24.95% and 32.53%, respectively, according to CoinGlass. For the leading cryptocurrency, this is the best monthly result since November 2025.
Historically, however, August has tended to be a “red” month for bitcoin. The asset has closed the month in the negative nine times. The worst drawdown was recorded in 2015 — a drop of more than 18%.

At the time of writing, bitcoin is trading at $78,722. As the chart below shows, the asset saw a sharp spike in the middle of the month, after which it moved within a new range.

For Ethereum, in turn, August is more of a neutral month. The asset has an even split of “red” and “green” closes during this period. The worst drawdown was recorded in 2018 — 34.8%.
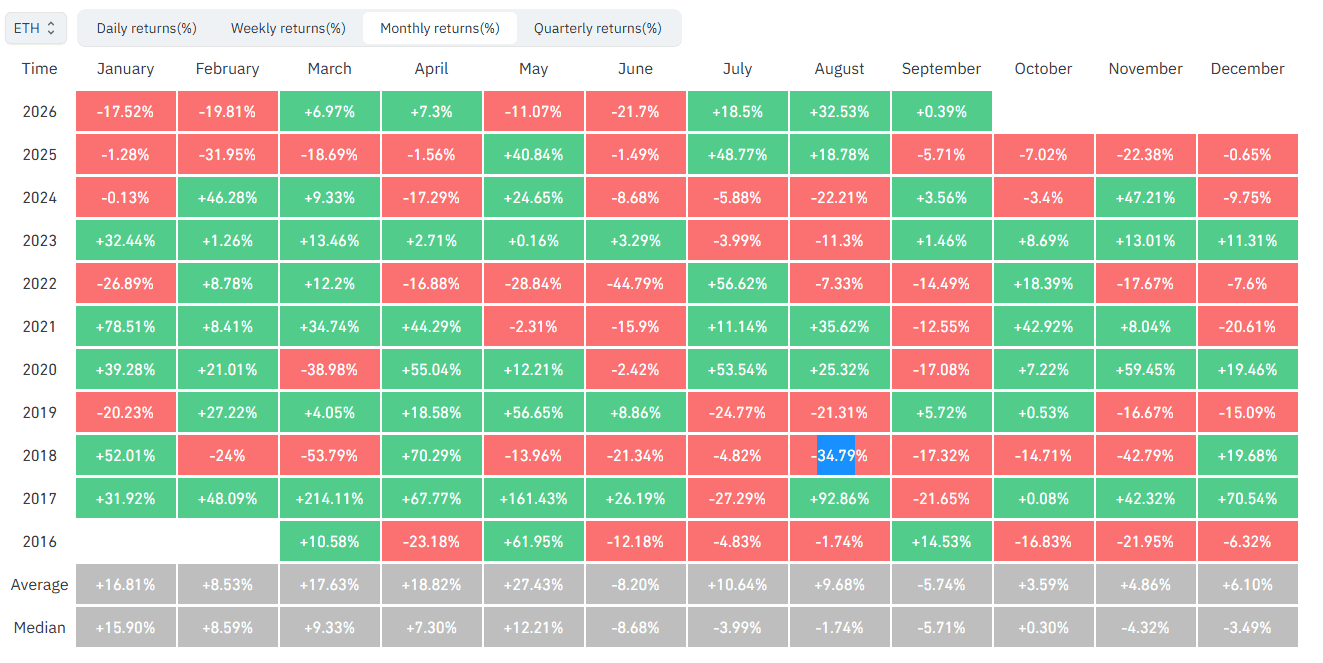
A similar mid-month spike is also visible on Ethereum’s chart. At the time of writing, the asset is trading at $2,473. As you can see, the coin failed to hold above $2,500.

What Drove This Surge?
In mid-August, several events took place that impacted the crypto market. In particular, US President Donald Trump held a meeting at the White House with industry representatives and urged Congress to approve a framework bill (CLARITY).
In addition, the US Treasury decided to double, starting September 9, 2026, the volume of bond buybacks for maturities from 10 years to 30 years. The move was explained as necessary to boost liquidity, although experts believe the Treasury was trying to curb rising yields amid an increase in public debt to more than $40 trillion.

This gave a boost to high-risk assets, including cryptocurrencies.
At the end of the month, the situation in the Middle East flared up again. Trump threatened the adversary with new strikes. Despite this, bitcoin and Ethereum barely reacted to this macro factor, even though these markets had previously shown volatility linked to the conflict.
Сообщение Bitcoin Closed the Month Up Nearly 25%, While Ethereum Gained 32% появились сначала на INCRYPTED.
Source: Incrypted