



FILTERED RESULTS
FILTERS
•
·
·
FILTERED RESULTS
The Carmaker Vying With Tesla to Conquer the Robot Future
Luxury Stocks Are Selling at Fast-Fashion Prices
U.S. debt could reach 160% of GDP within decade, Scope warns
Nvidia (NVDA) Reclaims Morgan Stanley’s Top Semiconductor Pick, Shares Touch $237.55
Trump Administration Eyes $4 Billion Loan for Vistra (VST) Nuclear Plants
Lloyds Banking Group Survey Shows British Financial Institutions Embrace Digital Assets
SpaceX (SPCX) Shares Jump 7% Following Record-Breaking 13-Hour Launch Window
Chainlink (LINK) Rallies 30% in One Month as CCIP 2.0 Launch Drives Institutional Demand
Why your wealthy best friend does not owe you a luxury lifestyle
Trump Says Economy Has ‘Public Relations’ Problem Amid High Prices and Slow Hiring
World Economy Latest: US Employers Dial Back Hiring, Wage Growth Slows
Weight Loss Drugs Give Restaurants a New Hurdle: Diners Who Eat Less
Merz to meet frontrunners for Lagarde job as ECB race heats up - Bloomberg
UAE Probe Labels FlyDubai Cockpit Axe Attack a Terrorist Act
Japan’s SMBC Nikko Securities Partners with Uniswap (UNI) Labs to Build Compliant DeFi Gateway by 2027
Cardano (ADA) Network Activity Surges 29% as Price Holds Above $0.25 Support
TRON (TRX) Crosses Historic $30 Trillion Milestone While Tron Inc. Accumulates 716.8M Tokens
Aave (AAVE) Surges Past $187 Following Cayman Foundation Governance Proposal
$3.8M Stolen from NEAR Intents Fully Recovered Following Omni Contract Exploit
Blast Network Closure: $2B Layer-2 Project Folds as Operating Costs Eclipse Revenue
Consumer AI agents: What does it mean for Financial Services?
Meet the DINKWADs, HENRYs and Elder Millennials Spending Their Own Way
Bitcoin (BTC) Surges Past $87,000 Following Disappointing September Payroll Numbers
Malaysia Eyes $245 Million Naval Missile System, Star Reports
FlyDubai attacker used crash ax in cockpit attack, UAE says - WSJ
Pressure builds on Iran as Trump expands U.S. military presence - Bloomberg
UAE Says FlyDubai Co-Pilot Used Emergency Ax in Crash Attempt
Merz Will Meet Frontrunners for Lagarde Job as ECB Race Heats Up
Europe’s Stocks Are Straining Under Pressure From Bond Yields
Flydubai co-pilot attacked pilot with axe, attempted ’terrorist’ attack, UAE says
Trump says U.S. will send $90 payment to over 20 million Medicare enrollees
Intel Stock Faces Challenges After Failed Rebound
Bridge across Dnipro river in Kyiv hit during Russian attack
US Debt Path Leaves It ‘Increasingly Exposed,’ Scope Warns
Analysis-AI’s race to transform the world before the money runs out
Trump Offering $90 Payments to 20 Million Medicare Recipients
G20 countries split over US push to curb excess industrial capacity
Fed’s Hammack says there is time to weigh next rate move
CGT rise would deter equity investors, wealth bosses warn
Why rising exports aren’t easing oil market fears
The right and wrong lessons to learn from Spain’s housing crisis
How airlines try to weed out rogue pilots
Rising gilt yields attract retail investors hunting for tax-efficient assets
How a Boeing 737 MAX Survived a Nosedive Traveling at the Speed of Sound
Trump Denies Reports on Federal Reserve Building Renovation
Trump says Iran war could end after U.S. elections as Hormuz tensions persist
Xi’s rest breaks cut hours from Trump summit schedule - WSJ
White House Filing Claims President Has Authority to Bar News Outlets
Japan shifts messaging to counter view its policies are reflationary, Katayama says in TV interview
Vietnam Nears 10% Growth as Economy Surges, Posts Trade Surplus
IMF Approves Bolivia Loan Deal to Support Paz’s Economic Reforms
FlyDubai attacker was previously banned from flying by Oman - WSJ
The Sneaker Taking Over America Was Inspired by iPhones and a Vacuum Cleaner
David Ellison Won Warner Bros. Now he Has to Make the $81 Billion Deal Work.
Chill out: Japan’s top vending machine maker now cools data centres
KLEA Finance Daily: Friday, October 02, 2026
ICBA Sues OCC to Stop Alleged Fast-Track of Crypto Bank Charters
The Brothers Dominating the $211 Billion Car Repair Market
BNY and Kraken Parent Payward Eye Global Financial Infrastructure Partnership
Wall Street Week | Your Brain on AI, Rare Earth Race, College Enrollment Cliff
Liberate’s AI Agents Take Over the Insurance Night Shift
G-7 Agrees to Release 100 Million Barrels of Diesel and Crude
Apple says it will flag AI requests for Mac data after Meta’s Muse draws complaints
Former CEA Chair on Jobs Report, GDP Growth
US appeals court blocks Minnesota law barring ’nudified’ photos in XAI lawsuit
Chinese auto show debuts in Argentina as sales surge
Boeing 737 Max Software Glitch Deemed No Safety Issue by FAA
OpenAI Hires Former White House Cyber Official as Regulators Probe AI Dangers
Morgan Stanley's Nike Analyst on quarterly earnings
XRP (XRP) Charts Show Ascending Triangle With Potential 2,000% Breakout Target at $31.87


TLDR
- Technical analyst Ali Martinez identifies an ascending triangle formation on XRP’s monthly timeframe, with critical resistance positioned around $3.66.
- Should XRP achieve a monthly close above the $3.66 threshold, the pattern’s technical measurement projects a potential move toward $31.87.
- Martinez’s broader crypto outlook includes long-range projections: Bitcoin eyeing $190,000, Ethereum targeting $8,800, and Solana aiming for $2,744.
- An alternative two-week timeframe fractal analysis indicates XRP might achieve a 125% advance toward the $3.40-$3.50 zone if historical patterns hold.
- Exchange withdrawal data reveals that large-scale XRP transfers now represent a growing percentage of total outflows from Binance and Coinbase platforms.
On October 3, XRP was changing hands near $1.48, registering a modest decline in the previous 24-hour period.
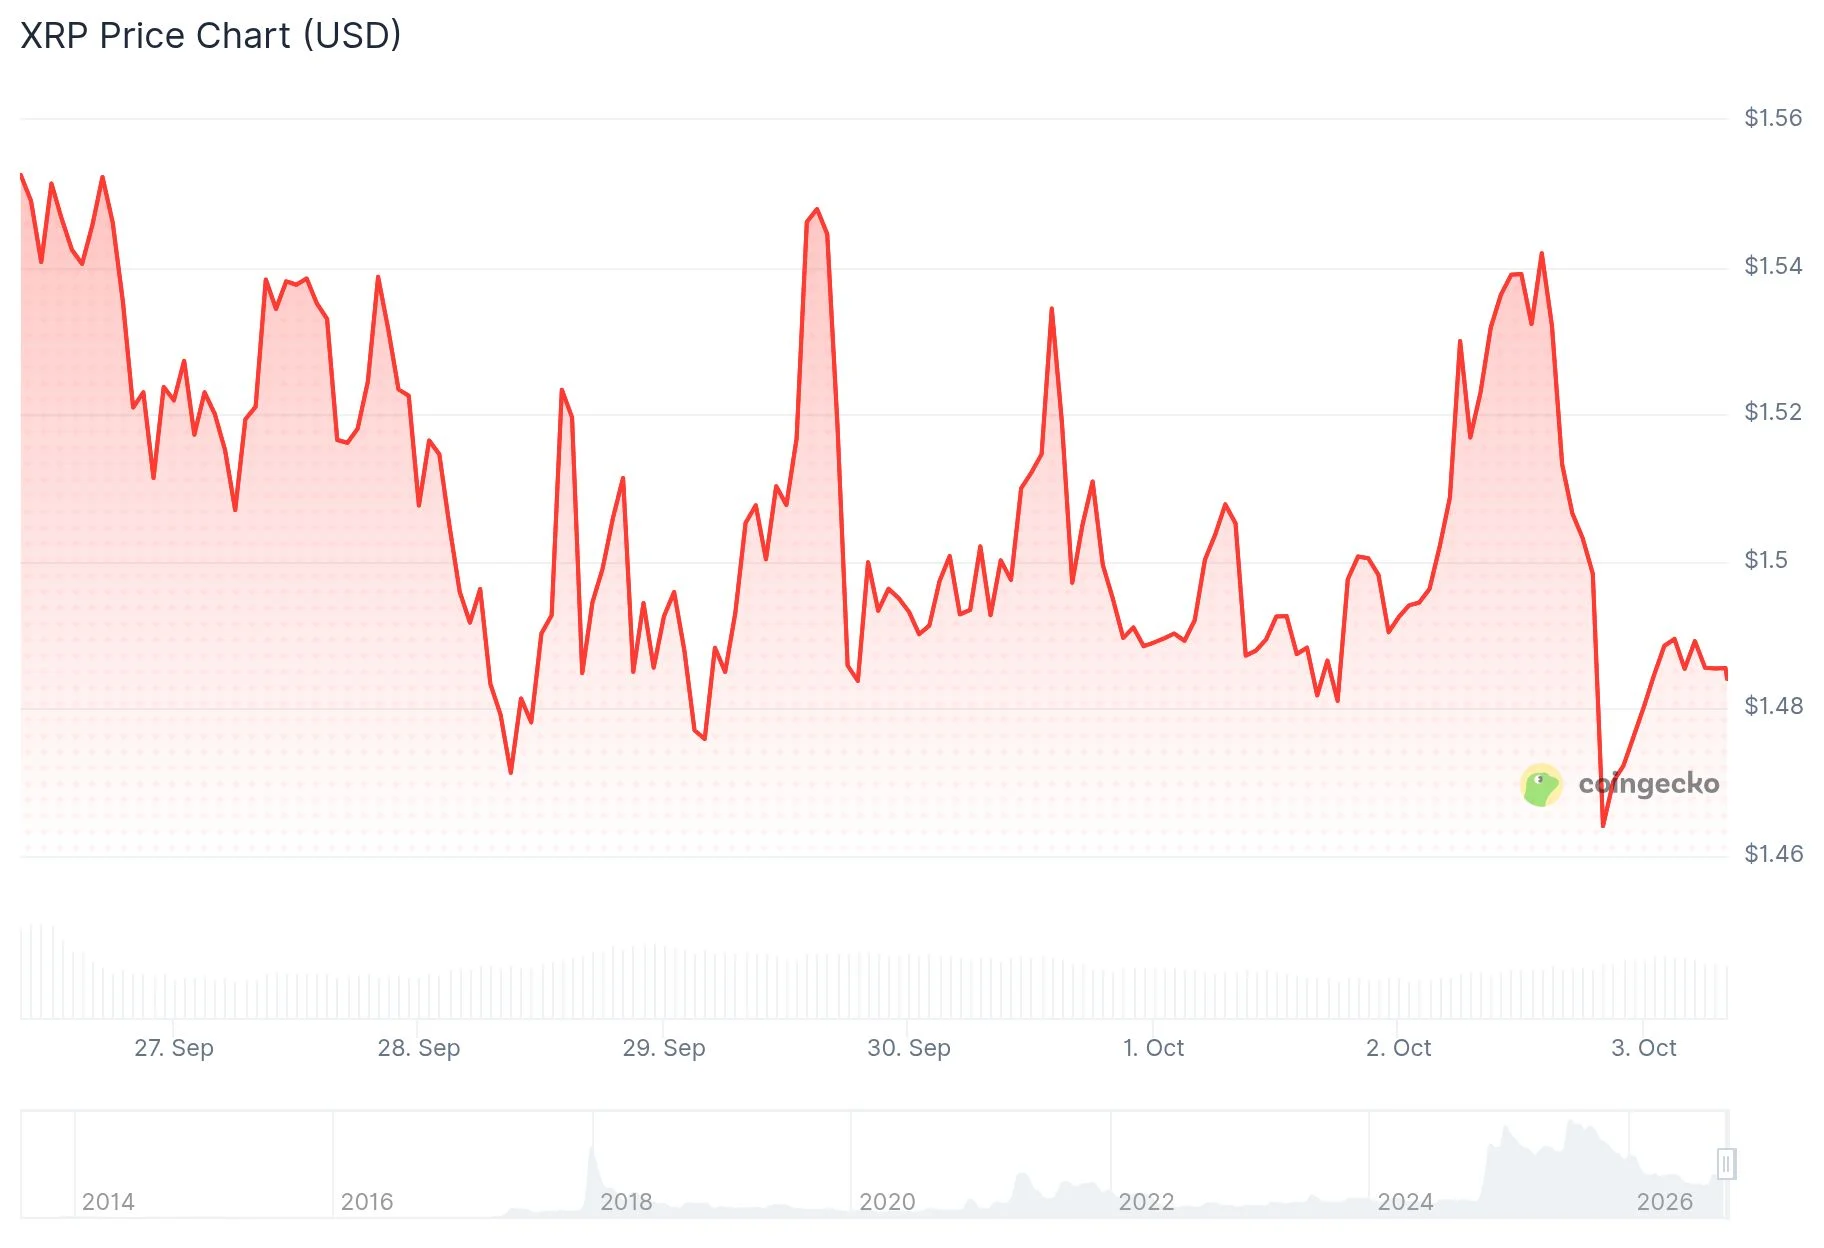
Despite the recent pullback, the digital asset has posted gains exceeding 50% from its August floor, moving in tandem with the broader cryptocurrency market recovery.
Market technician Ali Martinez has been examining XRP’s long-term chart structure. His analysis highlights the emergence of an ascending triangle configuration on the monthly chart.
This technical formation features a horizontal resistance barrier positioned around the $3.66 mark. XRP has approached this ceiling on multiple occasions but has failed to secure a monthly candle close beyond it.
According to Martinez, a decisive monthly candle closing above $3.66 would validate the breakout scenario. Based on the triangle’s height, the pattern’s measured objective extends to $31.87.
Such an advance from present price levels to $31.87 would represent an approximate 2,000% appreciation. Martinez emphasizes that this represents a technical projection rather than a certain outcome.
Comparing XRP To Bitcoin, Ethereum, And Solana
Martinez extended his technical framework to examine other leading cryptocurrency assets using comparable long-duration chart patterns.
His Bitcoin analysis identifies an ascending channel that has maintained its structure for two years. Should price action breach the upper boundary, Martinez envisions a potential advance toward $190,000, representing approximately 125% upside from current valuations.
Ethereum’s monthly chart displays a channel formation spanning five years. Assuming an upward trajectory from the $5,000 level, Martinez calculates a technical target of $8,800, translating to a 231% increase.
For Solana, Martinez observes a cup-and-handle pattern with a critical neckline positioned near $295. A confirmed breakout above this threshold could trigger a move toward $2,744, representing approximately 2,186% growth.
Market participant MikybullCrypto offered additional perspective on XRP’s technical setup. The trader stated that “$XRP is one of the most bullish charts out there,” projecting a target zone between $5 and $7 should the breakout scenario materialize.
This outlook aligns with the triangle breakout thesis Martinez presented, although the two analysts arrive at different price objectives.
A Second Pattern Points To A Smaller, Faster Move
A separate technical examination from FXEmpire draws attention to a recurring two-week fractal visible on XRP’s price chart.
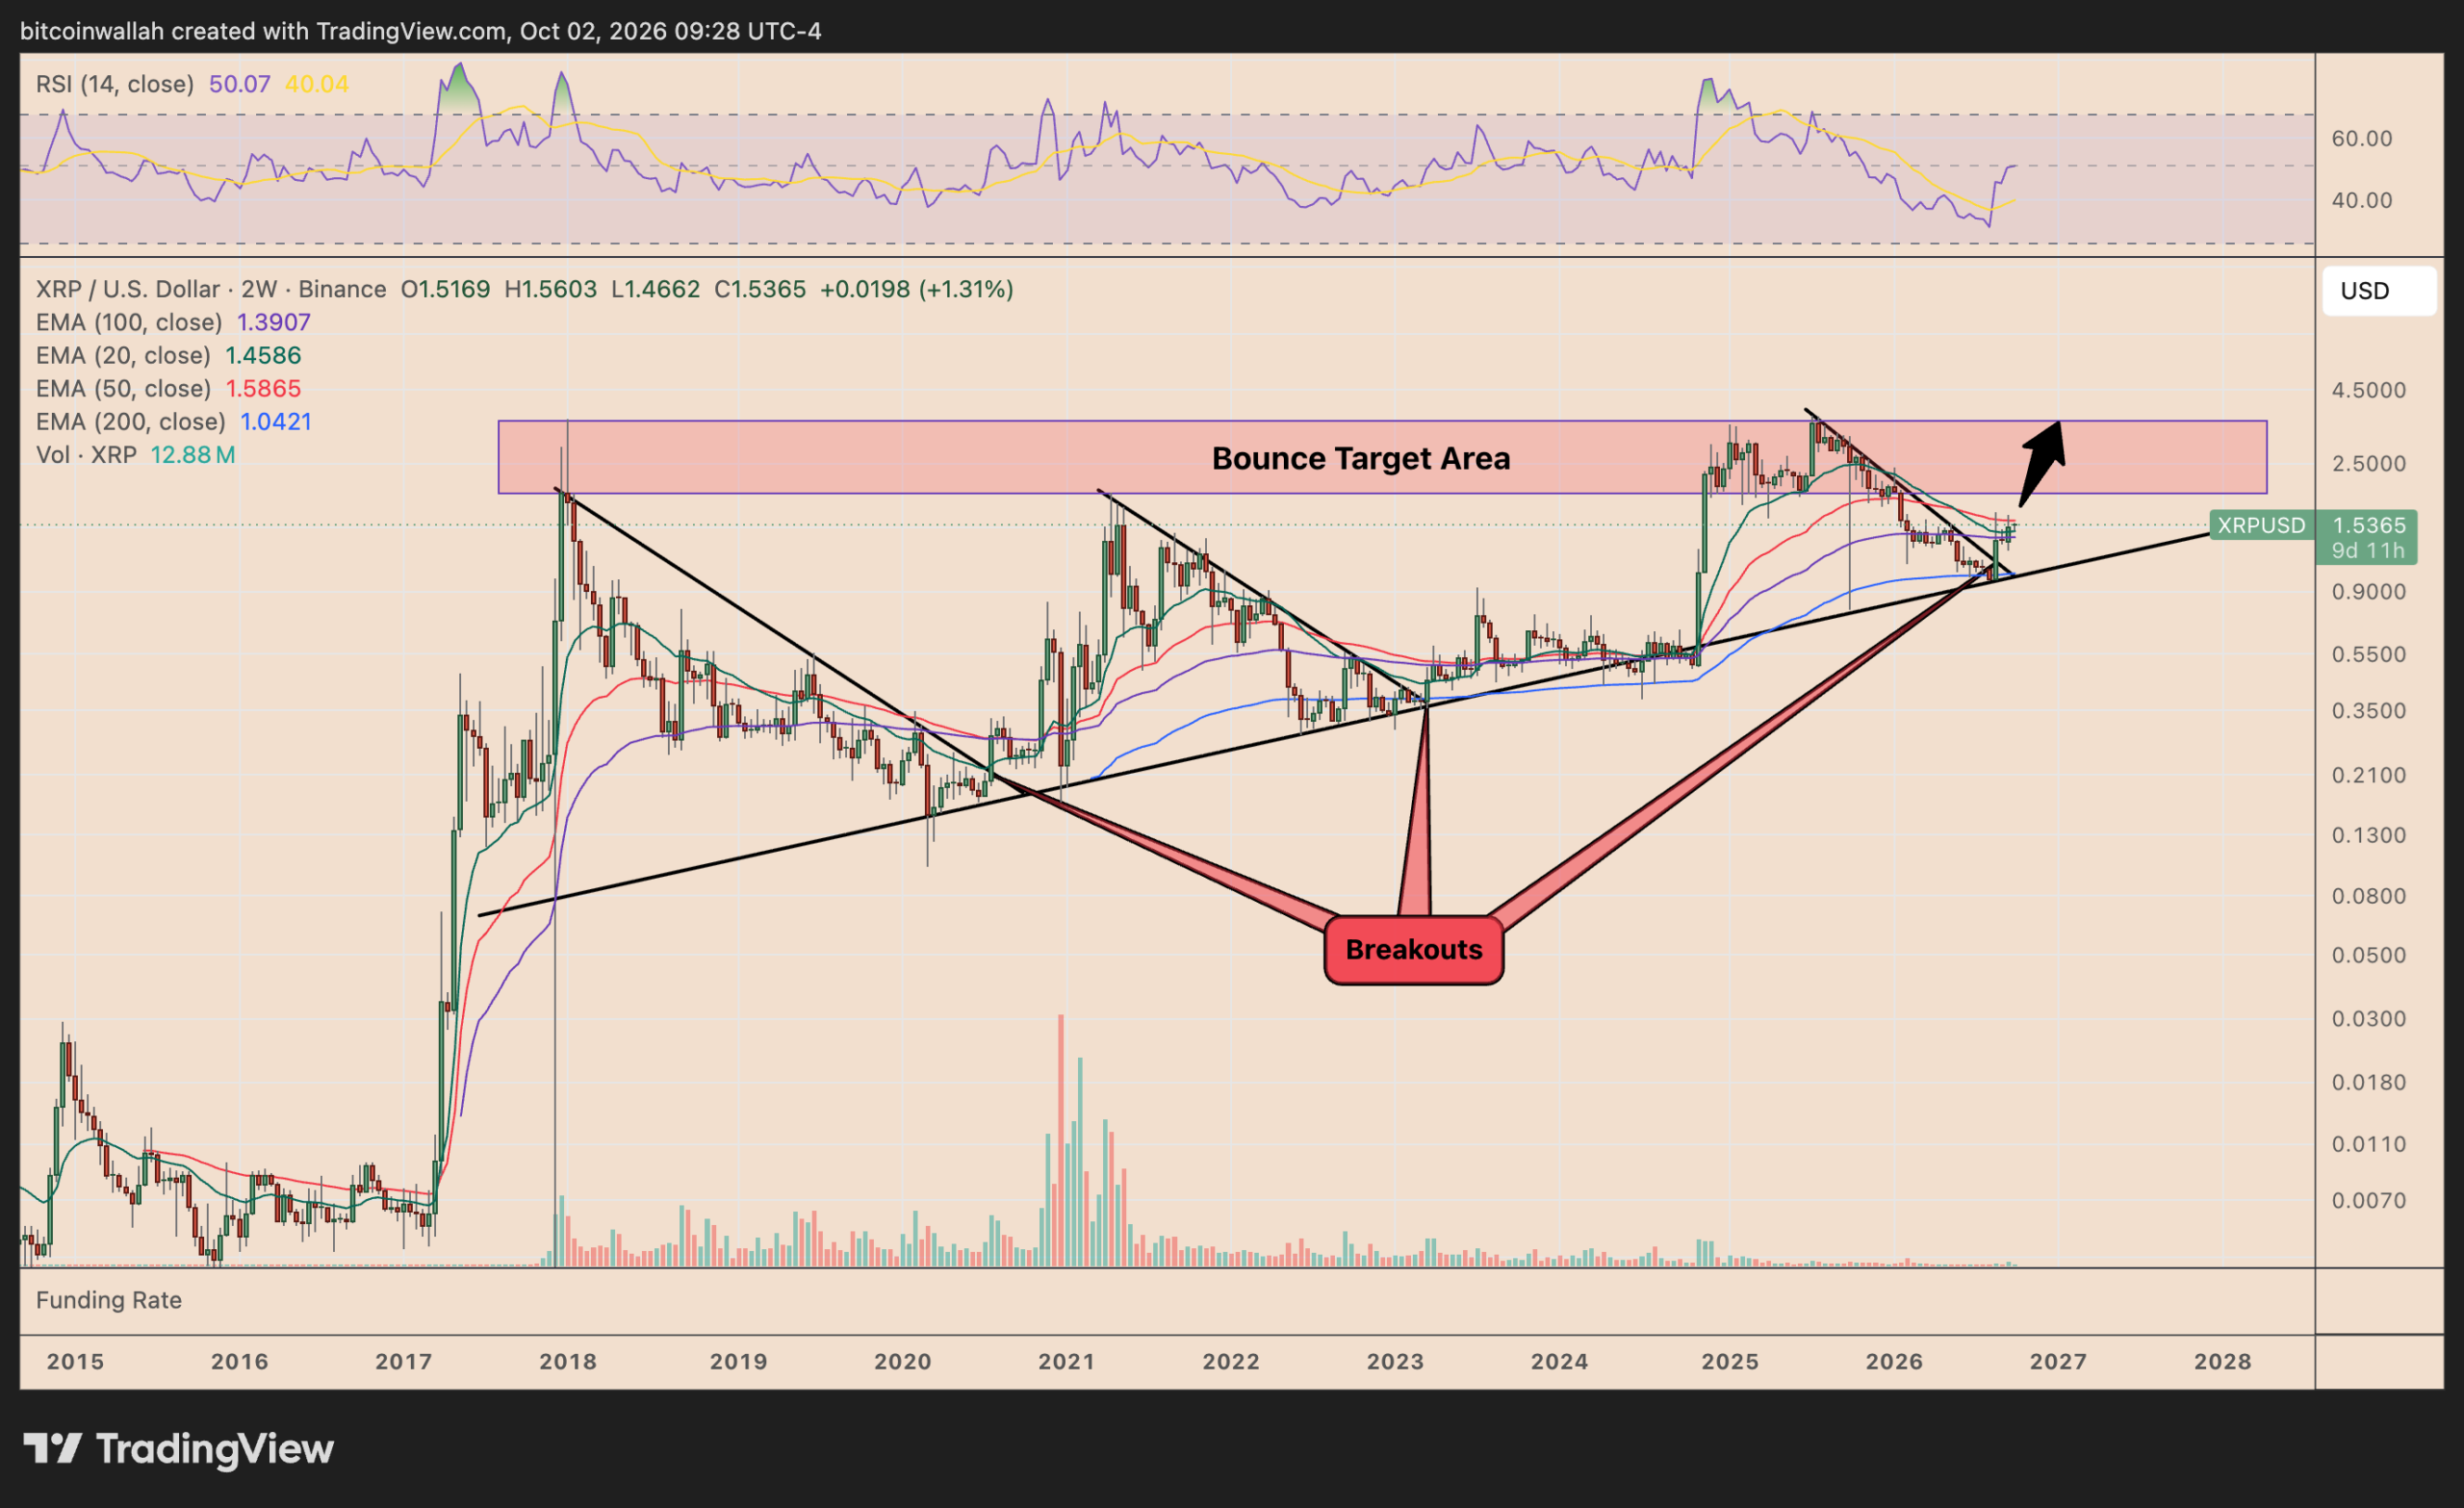
Historical data shows that XRP has consistently developed a descending resistance trendline following major price peaks, while simultaneously maintaining contact with a multi-year ascending support line.
This configuration emerged after XRP’s 2018 top, subsequently fueling a 900% rally that extended into 2021. The same structural pattern materialized after the 2021 peak, producing a 150% advance into 2025.
Current price action suggests this fractal is developing for a third iteration. XRP appears to be bouncing from the convergence zone where the descending resistance intersects with the long-term ascending support.
The two-week Relative Strength Index has recovered toward the neutral 50 level. Price action currently trades above both the 20-period and 100-period Exponential Moving Averages, though reclaiming the 50-period EMA around $1.59 would provide additional technical confirmation.
Should this fractal pattern replicate previous behavior, XRP could test the $3.40-$3.50 range, representing roughly 125% upside from current price levels.
Supporting this technical outlook, exchange withdrawal metrics provide additional context. Data from Binance reveals that transactions exceeding 1 million XRP accounted for 60.8% of total daily outflow value on September 30, climbing from approximately 45% in mid-August.
Coinbase exhibited comparable trends, with transfers of more than one million XRP reaching 48.7% of outflow value by September’s end, advancing from roughly 30% in early July.
Source: Parameter