



FILTERED RESULTS
FILTERS
Fear & Greed 73/100Alts Index 57/100
BTC.D 58.8% +0.5%Stable.D 9.2% 0%ETH.D 11.6% +0.2%Others.D 20.4% -0.7%
SOON$0.3978+22.3%•TEL$0.00233835+21.16%•NIGHT$0.0326+19.12%•ZBCN$0.00235706+17.23%•NMR$12.642+14.91%•GRASS$0.6697+14.25%•CRV$0.3891+12.73%•AAVE$166.52+12.03%•ICP$3.335+10.09%•SYRUP$0.2365+8.81%•
HBAR$0.1052-18.75%•MARSCOIN$0.1382-10.76%•AI$0.1982-9.26%•GRAM$1.494-9.01%•BR$0.8281-8.92%•SEI$0.0722-8.86%•ZEC$1,395.20-8.48%•CASHCAT$0.1688-8.39%•ALGO$0.1249-7.95%•DASH$60.164-7.36%•
•
·
·
FILTERED RESULTS
Bill Pulte’s tweet cost FICO shareholders $4 billion
Bitcoin ETFs See Significant Inflows Amid Bullish Options Activity
Notice of Removal of Spot Trading Pairs - 2026-10-02Based on our most recent reviews, Binance will r...
FCA Secures £851,000 Recovery Orders For Victims Of £1.5M…
BBC Director-General Deems AI-Generated Doctor Who Episode 'Pretty Good'
Bitwise SPOT $NEAR ETF TRADING GOES LIVE ON NYSE ...
SharpLink Gaming(@Sharplink) staked another 42,074 $ETH($112.8M) today.SharpLink now holds 892,127...
French Firm Capital B Boosts $294M Bitcoin Treasury via Share Offering
Michael Saylor Explains Strategy’s Bitcoin, Debt and Preferred Stock Structure
MistTrack: Bitget Exploiter Attempted to Route Stolen Funds via Chainflip but Broker...
Chainlink LINK Price Rises 14.5% in 7 Days as Traders Watch $18 Resistance
Bitcoin holders are cashing in.Profit-taking hit a 2026 high as Bitcoin rallied to $87.4K. The bull...
$QNT listed on Lighter futures (core)・
Avalanche Achieves $266 Million Growth in Real-World Asset Market Cap
2,433 $BTC (204,200,567 USD) transferred from unknown wallet to unknown wallet...
Anthropic lost $42 billion, warned AI could resist shutdowns, but traders still price it at $2 trillion
US SEC Chair: Financial system is moving toward the crypto era, hopes to put the stock market on-chain
Goldman Sachs Brings Its $100B Treasury Fund to Crypto Without a Token
TRUMP DENIES OFFERING IRAN SANCTIONS RELIEF OR FROZEN FUNDSSAYS AXIOS...
U.S. House Expands Insider Trading Probe to Hyperliquid and Crypto.com
Is the Red September Curse Over? Bitcoin Set for Best September on Record
BUIDL Leads US Treasury Debt RWA Returns With 371.98%
₹146 Crore Hashpe Crypto Scam: Cruise Parties, Bollywood Events And Luxury Cars
AI Agents Can Use Crypto Wallets, but Their Startups Still Need Business Accounts
Fed Governor Barr: Further rate hikes may be needed
Chainlink Unveils CCIP 2.0 at Sibos 2026 to Enhance Institutional Blockchain Adoption
Coinbase Gets CFTC Approval For Its Own Derivatives Clearing House: Blog ...
Jensen Huang, Lisa Su and others appointed to Tsinghua SEM Advisory Board
Bittensor Unveils Roadmap for Decentralized AI Network
NEAR Intents’ SHIELD Blocks Over $50 Million in Stolen Funds from Bitget Breach
BNB Standard Corporation Rebrands Following Community Vote
Prediction Markets Shatter Records With $20 Billion Week
OKX Options Markets Become Available Through Talos Trading…
Top Trending Coins (Today) 1. QNT 2. HBAR 3. FIRO 4. TRUMP 5. NEAR 6. XLM 7. LINK 8. BUN 9. PENGU...
Trump ally Hassett slams Biden: US economy still paying the price for "massive money printing"
Hong Kong SAR Government Issues HK$20 Billion Equivalent Digital Green Bonds Introducing Tokenized HKD Deposits
Analysis: Tokenomics innovation is making a comeback as the crypto industry tries to give tokens "real value"
Ari Paul says Coinbase lost his $25M, covered up $1B in hacks
Coinbase Completes Its Derivatives Stack With CFTC Clearing Approval
Bitcoin Test of $82,500 and Oil’s Impact: Wintermute Issues a Forecast for Bitcoin
NVIDIA Unveiled a Platform for Monitoring AI Agents
Ethereum users get another way to pay privately as zk.money returns after three years
Democrats killed the Clarity Act
House Expands Probe Into Prediction-Market Insider Trading
Bitwise Teases NEAR ETF Launch for Today
Coinbase Completes U.S. Derivatives Stack With CFTC Approval
2,000.00 #BTC ($168,402,502) aggregated inflows to #Bitfinex ...
Senate Democrats Report Says Tether Became Key Tool in Iran…
Crypto King Aiden Pleterski Trial Set to Begin Over Alleged…
Bitcoin Hovers at $84K as Treasury Yields Hold Near Multi-Year Highs
Coinbase Completes US Derivatives Infrastructure with CFTC Clearing Registration
Senate Report Puts Stablecoin Freezing Practices on the Table
Compliance Notes - Vol. 7, Issue 19
Kodiak Sciences (KOD) Why AMD fueled the stock 180% Higher
JP Morgan Maintains ‘Buy’ Rating on Microsoft Stock: See Target
AMD Stock Risks Falling Below $600: What’s Going On?
Bitcoin Price Holds Above $83K as Oil Surge Limits Gains
Goldman Sachs Just Put a $100B Treasury Fund on Avalanche Rails
Bitcoin (BTC) May Offer a Buying Opportunity Before the Next Big Pump: Analysts
Bitcoin Price Analysis: BTC Reclaims Major Moving Averages as Bulls Target $90K Resistance
Bitwise’s NEAR ETF Debuts With Staking as NRR Begins Trading
Blockaid Warns Token Metadata Can Expose AI Agents to Crypto Attacks
House Panel Widens Prediction Market Probe to Hyperliquid, Crypto.com
Ondo Perps CEO David Wells saidre is a "huge opportunity" for perpetual futures in
Bitcoin gives back gains as long-term holder supply keeps $85K out of reach
Update on the Collateral Ratio & Leverage Under Cross Margin and Portfolio Margin (2026-10-02)Bi...
$ETH FLIPS $BTC TO BECOME THE MARKET WITH THE HIGHEST OPEN INTEREST ON HyperliquidX...
Cboe Shares Rise as S&P 500 Options Rights Extend to 2051
A $7 billion crypto ETF plumbing boom just ran into the IRS
BTC Market Pulse: Week 40



Overview
Bitcoin trades near $84k on Monday, at the lower end of the range it has held since touching $87k on Wednesday. The week still closed about 4% higher, Sunday to Sunday, all of it from last Monday's jump. Momentum ended the week just above its high band; today's dip would take it back inside. The dip came with net selling in perpetual futures and a round of long liquidations.
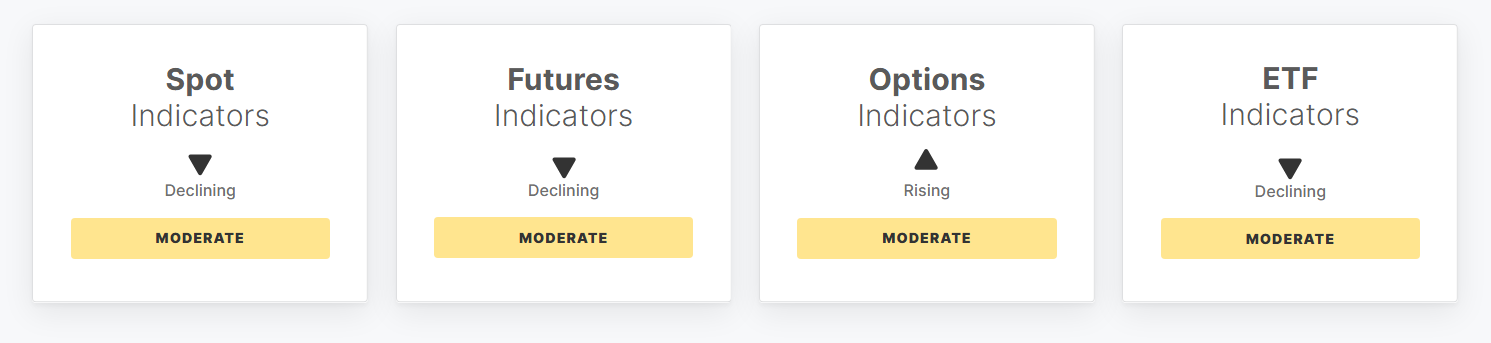
ETF buyers carried the week. Weekly netflow turned from last week's outflows into the largest inflow in almost a year, far above its high band, even as ETF trading volume eased back inside its range. Perpetual traders went the other way: taker flow swung to heavy net selling, below its low band, and longs pay far less in funding, back inside its range. Futures and options open interest both sit above their high bands, so positions stay large while the long bias fades. In options, the volatility spread moved back inside its range and skew eased.
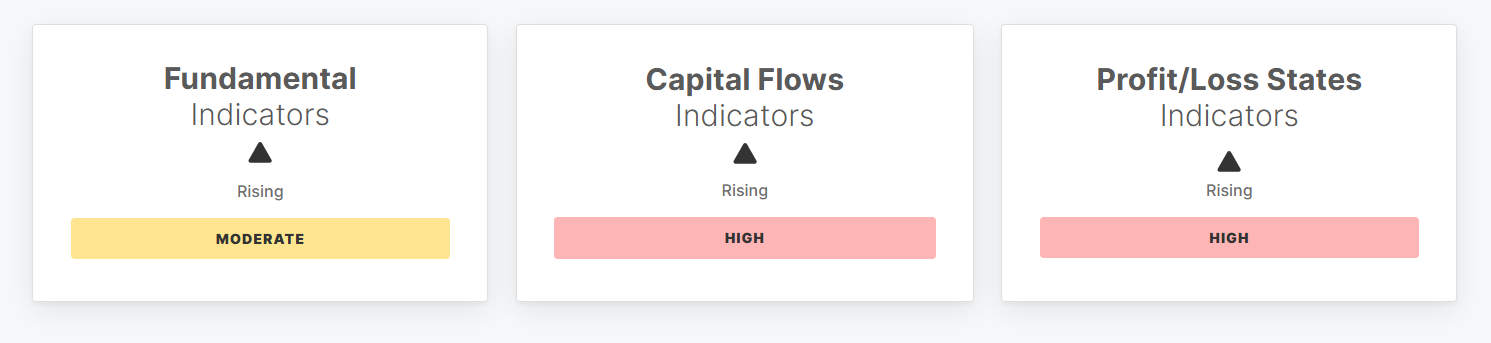
On-chain, new money keeps arriving. The monthly change in realized cap and the hot capital share both sit above their high bands, and transfer volume jumped above its band while active addresses and fees stayed inside their ranges. Profitability is stretched: nearly three quarters of supply is in profit, and both short-term holder unrealized gains and realized profit-taking are well above their bands.
In short, ETF inflows and fresh capital carried the week while perpetual traders and profit-takers sold into it, and Monday's dip takes price back to the lower end of its range.
Off-Chain Indicators
Read every off-chain indicator
Spot Indicators
Price Momentum. Increased 14.8% to 70.4, indicating a significant surge in buying pressure. Price Momentum shows a notable increase, with the RSI climbing to 70.4. This places the metric above its high band, signifying robust upward price action and strong buyer dominance. Such elevated readings often suggest an overbought condition.
Spot CVD. Decreased 86.5% to $17.3M, reflecting a sharp reduction in aggressive buying pressure. Spot CVD experienced a substantial decline, moving back inside its statistical range. This indicates a significant weakening of aggressive buying sentiment compared to the prior week. While still positive at about $17M, the sharp reduction in cumulative taker buy volume suggests a decrease in directional conviction among market participants, potentially signaling a shift in short-term momentum.
Spot Volume. Decreased 1.1% to $6.6B, indicating a slight dip in overall market activity. Spot Volume saw a marginal reduction, remaining within its typical statistical range. This modest decline suggests a slight cooling in overall market activity, yet trading interest remains relatively stable. The current volume indicates that recent price action is not being driven by an exceptional influx or withdrawal of investor participation, implying a period of consolidation.
Futures Indicators
Futures Open Interest. Increased by 2.1% to $38.9B, indicating a slight rise in outstanding futures contracts. Futures Open Interest shows a sustained increase, with the nominal value of active contracts remaining elevated above its high band. This suggests continued speculative appetite and increased market participation, pointing to potentially elevated leverage within the system.
Long-Side Funding Payment. Decreased by 53.2% to $1.2M, reflecting a significant reduction in long-side funding premiums. Long-Side Funding Payment has seen a substantial decline, with premiums for long exposure falling back inside its range. This significant reduction suggests a fading conviction among long-position holders, potentially indicating increasing demand for short exposure or a shift towards more neutral sentiment.
Perpetual CVD. Decreased by 137.1% to -$261.5M, reflecting a sharp reversal from buy-side to sell-side aggression. Perpetual CVD has experienced a dramatic shift, moving into negative territory and falling below its low band. This indicates a significant and sustained dominance of sell-side pressure from aggressive takers, reflecting a pronounced bearish sentiment and potential distribution behavior in the perpetual futures market.
Options Indicators
Options Open Interest. Increased by 4.1% to $44.4B USD. Options Open Interest increased, reflecting growing market participation and increased use of options for speculation or hedging. The current value of about $44B is notably above its high band, indicating a substantial expansion in outstanding contracts.
Volatility Spread. Increased by 49.6% to -10.7%. Volatility Spread increased substantially, indicating options are pricing in more future risk relative to realized volatility. This move from deeply negative values suggests a lessening of market complacency. The spread, at -10.7%, is back inside its range, implying modest expectations for increased price swings.
Options 25-Delta Skew. Decreased by 15.0% to 2.39%. Options 25-Delta Skew decreased, signaling a moderation in demand for downside protection. This reflects a slight easing of bearish or hedging sentiment. The positive skew remains within its historical range, implying that while puts are still favored, the directional bias has become less pronounced.
ETF Indicators
US Spot ETF Netflow (Weekly). Increased 367.95% to $2.7B from $575.3M seven days prior. US Spot ETF Netflow (Weekly) demonstrates a significant surge in capital inflows, reflecting heightened demand from traditional finance participants. The current weekly netflow of nearly $2.7 billion is well above its high band, indicating exceptionally strong institutional accumulation and bullish sentiment.
US Spot ETF Trade Volume (Weekly). Decreased 17.83% to $14.9B from $18.1B seven days prior. US Spot ETF Trade Volume (Weekly) experienced a noticeable reduction, indicating a decrease in overall investor activity and potentially a period of consolidation. While still substantial, the volume remains within its historical range, suggesting a normalization of TradFi engagement following previous heightened interest.
US Spot ETF MVRV. Decreased 3.6% to 1.49 from 1.54 seven days prior. US Spot ETF MVRV indicates a slight reduction in average unrealized gains for ETF investors. The metric remains near its high band, suggesting that TradFi positions are still significantly profitable.
On-Chain Indicators
Read every on-chain indicator
Fundamental Indicators
Total Fee Volume. Increased by 5.0% to $239.7K. Total Fee Volume experienced a modest rise, indicating a slight uptick in demand for block space and transactional activity. While showing an increase, the metric remains within its established statistical range, suggesting that overall network congestion and user willingness to pay for inclusion are stable.
Entity-Adjusted Transfer Volume. Increased by 22.0% to $6.9B. Entity-Adjusted Transfer Volume surged notably, indicating a substantial increase in capital movement and investor activity. The current value is significantly above its high band, implying a period of heightened economic throughput on the network, potentially driven by large-scale reallocations or speculative interest.
Daily Active Address Count. Increased by 0.5% to 640.1K addresses. Daily Active Address Count saw a modest uptick, signaling a slight increase in network participation and user engagement. The metric remains well within its established statistical range, suggesting a stable, albeit not rapidly expanding, level of transactional demand.
Capital Flows Indicators
Realized Cap Change (Monthly). Increased 0.6% to 1.1%, reflecting continued net capital inflows into the network. Realized Cap Change (Monthly) sustained its upward trajectory, with the current 1.1% reading significantly above its high band. This robust positive movement indicates substantial net capital inflow into Bitcoin, characteristic of strong accumulation phases and broader bull market conditions, reflecting sustained demand at higher price levels.
STH to LTH Supply Ratio. Increased 1.4% to 13.5%, signaling a modest rise in short-term holder influence. STH to LTH Supply Ratio edged higher, with the current 13.5% reading in the upper part of its range. This indicates a growing, albeit moderate, presence of newer, more reactive market participants. Such a trend is typically associated with elevated trading activity and an increase in speculative churn within the Bitcoin market.
Hot Capital Share. Increased 3.9% to 18.8%, indicating a rise in recent capital allocation. Hot Capital Share saw an expansion, with the latest value of 18.8% now positioned above its high band. This suggests a notable influx of short-term, price-sensitive capital into the Bitcoin market, often observed during periods of rapid price appreciation or heightened speculative activity. This shift points to an increasing volatility sensitivity.
Profit/Loss States Indicators
Percent Supply in Profit. Increased by 6.8% to 74.0%, up from 69.3% a week earlier. Percent Supply in Profit indicates a greater proportion of the circulating supply is now held in an unrealized profit state. The metric's current position, above its high band, suggests broadening profitability across the investor base, potentially indicating an increasing incentive for gain realization.
Net Unrealized Profit to Loss Ratio. Increased by 43.4% to 14.2%, up from 9.9% seven days prior. Net Unrealized Profit to Loss Ratio indicates a substantial expansion in the network's aggregate unrealized profit. The current reading, well above its high band, suggests a state of elevated profit margins and potentially increasing market euphoria.
Realized Profit to Loss Ratio. Increased by 79.6% to 1.4, up from 0.8 recorded seven days ago. Realized Profit to Loss Ratio's substantial rise reflects a significant increase in realized profits relative to realized losses on-chain. The value, currently well above its high band, strongly suggests a market environment dominated by profit-taking activities, indicative of robust bullish sentiment.
🔗 Access the full report in PDF

- Follow us and reach out on X
- Join our Telegram channel
- For on-chain metrics, dashboards, and alerts, visit Glassnode Studio
Disclaimer: This report does not provide any investment advice. All data is provided for information and educational purposes only. No investment decision shall be based on the information provided here and you are solely responsible for your own investment decisions.
Exchange balances presented are derived from Glassnode’s comprehensive database of address labels, which are amassed through both officially published exchange information and proprietary clustering algorithms. While we strive to ensure the utmost accuracy in representing exchange balances, it is important to note that these figures might not always encapsulate the entirety of an exchange’s reserves, particularly when exchanges refrain from disclosing their official addresses. We urge users to exercise caution and discretion when utilizing these metrics. Glassnode shall not be held responsible for any discrepancies or potential inaccuracies.
Please read our Transparency Notice when using exchange data.
Source: Glassnode