



FILTERED RESULTS
FILTERS
MCap $2.9T +0.6%24h Vol $116.6B +20%Fear & Greed 72/100Alts Index 51/100
BTC.D 58.8% +0.1%Stable.D 9.1% 0%ETH.D 11.3% -0.1%Others.D 20.8% 0%
SAND$0.0619+43.37%•CARDS$0.2493+22.4%•NIGHT$0.0462+18.3%•WLD$0.5727+17.85%•SKY$0.0945+16.72%•APE$0.1706+15.92%•GALA$0.00258821+15.01%•ZRO$1.945+13.78%•MANA$0.1001+13.11%•ATH$0.00652888+12.23%•
BR$0.6682-11.58%•SOON$0.3909-9.41%•BP$1.360-8.56%•CAP$0.0782-6.82%•KNTQ$0.3160-5.93%•STX$0.3657-5.89%•JASMY$0.00541011-5.85%•FF$0.1184-5.74%•PROM$6.248-5.69%•XDC$0.0334-4.68%•
•
·
·
FILTERED RESULTS
Drift Opens DFX Claims at 1 Cent Per Token After April Exploit
Unpatched Eclair Bitcoin Lightning nodes could crash again every time they restart
5,292 $BTC (452,404,047 USD) transferred from unknown wallet to unknown wallet...
Kalshi Reports 84% Chance Fed Holds Rates in October
Blast Announces Shutdown of Layer 2 Due to High Costs
2,398 $BTC (205,122,184 USD) transferred from #Coinbase to unknown wallet...
Blast said it will wind down its Layer 2 network because operating costs exceed revenue
Zano Attacker Minted 36.9 Million ZANO and 1.8 Quadrillion…
Ripple Partner SBI Completes Takeover of Japanese Exchange Bitbank
Dormant Ethereum Wallets Activate as Exchange Balances Remain Stable
929 $BTC (79,408,478 USD) transferred from unknown wallet to #Coinbase...
Ethereum rises 70.8% in Q3, its strongest quarterly performance since Q1 2021
Total crypto liquidations hit $393 million in past 24 hours, mostly shorts
Zondacrypto Probe Deepens as Poland Forms Seven-Prosecutor Team
Aave Founder Challenges EU Push to Tighten Rules Around DeFi
Bitcoin briefly hits $87K as weak US jobs data sends bond yields lower
https://t.co/pruCGYtyfP https://t.co/AaLrvd52coSource: The Block…
Bitget Hack: How AI Helped in Tracing $387 Million Across Chains
Blast to Shut Down After Raising $20 Million From Paradigm and Others in 2023Ethereum Layer 2...
Morpho Surpasses $500 Million in Deposits on Circle’s Arc in Two Weeks
1,070 $BTC (91,528,781 USD) transferred from unknown wallet to #Coinbase...
Grayscale's AI Crypto Sector Surges 54% in September, Outperforming Broader Market
Hyperliquid Expands HYPE Token to Multichain Ecosystems via Wormhole
Layer 2 Network Blast to Cease Operations, Users Urged to Withdraw Assets by October 26
Drift exploit victims can now claim recovery tokens, but cashing out at launch getsm
A wallet unstaked 956,600 SOL, worth about $116 million
SEC’s Hester Peirce Departs After Shaping US Crypto Policy for Eight Years
956,610 $SOL (115,617,329 USD) stake unlocked at unknown wallet...
Ethereum Price Analysis: ETH Bulls Eye $3K Again – Can They Finally Break Through?
Bull Market Targets for BTC, ETH, XRP, and SOL: Analyst
Stellar's Tokenized Real-World Asset Market Reaches $4 Billion
Pons enters V3 mode; whether to adopt Bonding Curve will be decided by creators
SEC Opens Path for Advisers to Self-Custody Crypto
Tokenized Robinhood Shares Fueled $440M in Memecoin Speculation
ETHEREUM L2 blast IS SHUTTING DOWN ...
South Korea Opens $5 Trillion Market to Tokenized Stocks, Bonds in 2027
Blast to cease operations, advises users to withdraw assets to Ethereum mainnet before October 26, 2026
Fhenix Will Launch Its Mainnet With Support for Confidential Tokens on October 21
Aave Founder Says v3 Unaffected by $305,000 Third-Party…
Trader Huang Licheng Reports $1.34 Million Profit from PUMP Wave Trades
SMBC Nikko and Uniswap Collaborate on Japan-Compliant DeFi Gateway
Machi(@machibigbrother) has been doing well on $PUMP recently.He has won 10 $PUMP trades in a row...
Machi Big Brother wins 10 consecutive trades on PUMP in past 5 days, profiting $1.34 million
Lido updates EarnUSD fee model: more performance-weighted, capped at 0.5% management fee + 20% performance fee
ens.eth sold another $3 million in ETH 4 hours ago
How to Spot “Dirty” Cryptocurrency? 5 AML Checkers for Screening Assets
How to Sell Crypto as a Corporation: Accounting Treatment,…
NVIDIA Stock Hits Record High Amid Increased Buyback Plan
Robinhood's Blockchain Sees $440 Million in Memecoin Trading
ens.eth(@ensdomains) sold another 1,097 $ETH ($3M) at $2,743 4 hours...
Charles Hoskinson’s Midnight NIGHT Surges 159% After Biggest Crash
Solana Achieves Record Spot DEX Volume of $197 Billion in Q3 2026
Get Paid to Learn About Crypto: Platforms That Reward You…
Bitcoin Lightning Nodes Targeted as Core Lightning Sounds Alarm
BLOOMBERG REPORTS “ROBINHOOD STOCK TOKENS FUELED A $440 MILLION MEMECOIN FRENZY”...
Oct 2 Update:#Bitcoin ETFs:1D NetFlow: +1,383 $BTC(+$120.25M)7D NetFlow: +2,467...
Chainalysis Attributes Bitget’s $387M Hack to DPRK Actors, Traces Funds Across Four...
Bitcoin ETF saw net inflow of 1,383 BTC today, Ethereum ETF saw net outflow of 23,436 ETH
Jiang Zhuoer: ETH staking exit queue hits 2026 high, some holders looking to lock in profits
South Korea’s Crypto Exchanges See Profits Collapse…
Blockworks Launches Dashboard for OlympusDAO Financial Tracking
500,000,000 $USDT (499,802,500 USD) transferred from Tether Treasury to...
The G7 will release up to 100 million barrels of diesel and crude from...
NEAR Intents exploiter sends 1 BNB to recovery wallet with message offering cooperation
The IMF Urged El Salvador to Stop Further Bitcoin Accumulation
Bybit CEO Discusses Security Overhaul and Future Plans in Turkey
Cardano’s DeFi has shrunk by more than half and RealFi is betting credit can revive it
RWA Foundation Reports 717 Stablecoin Deployments Amidst Growing Market
Korea Blockchain Week 2026 Explores AI Integration with Blockchain Technology
Why an $88 billion bank reserve drop doesn’t prove a Bitcoin liquidity squeeze – yet


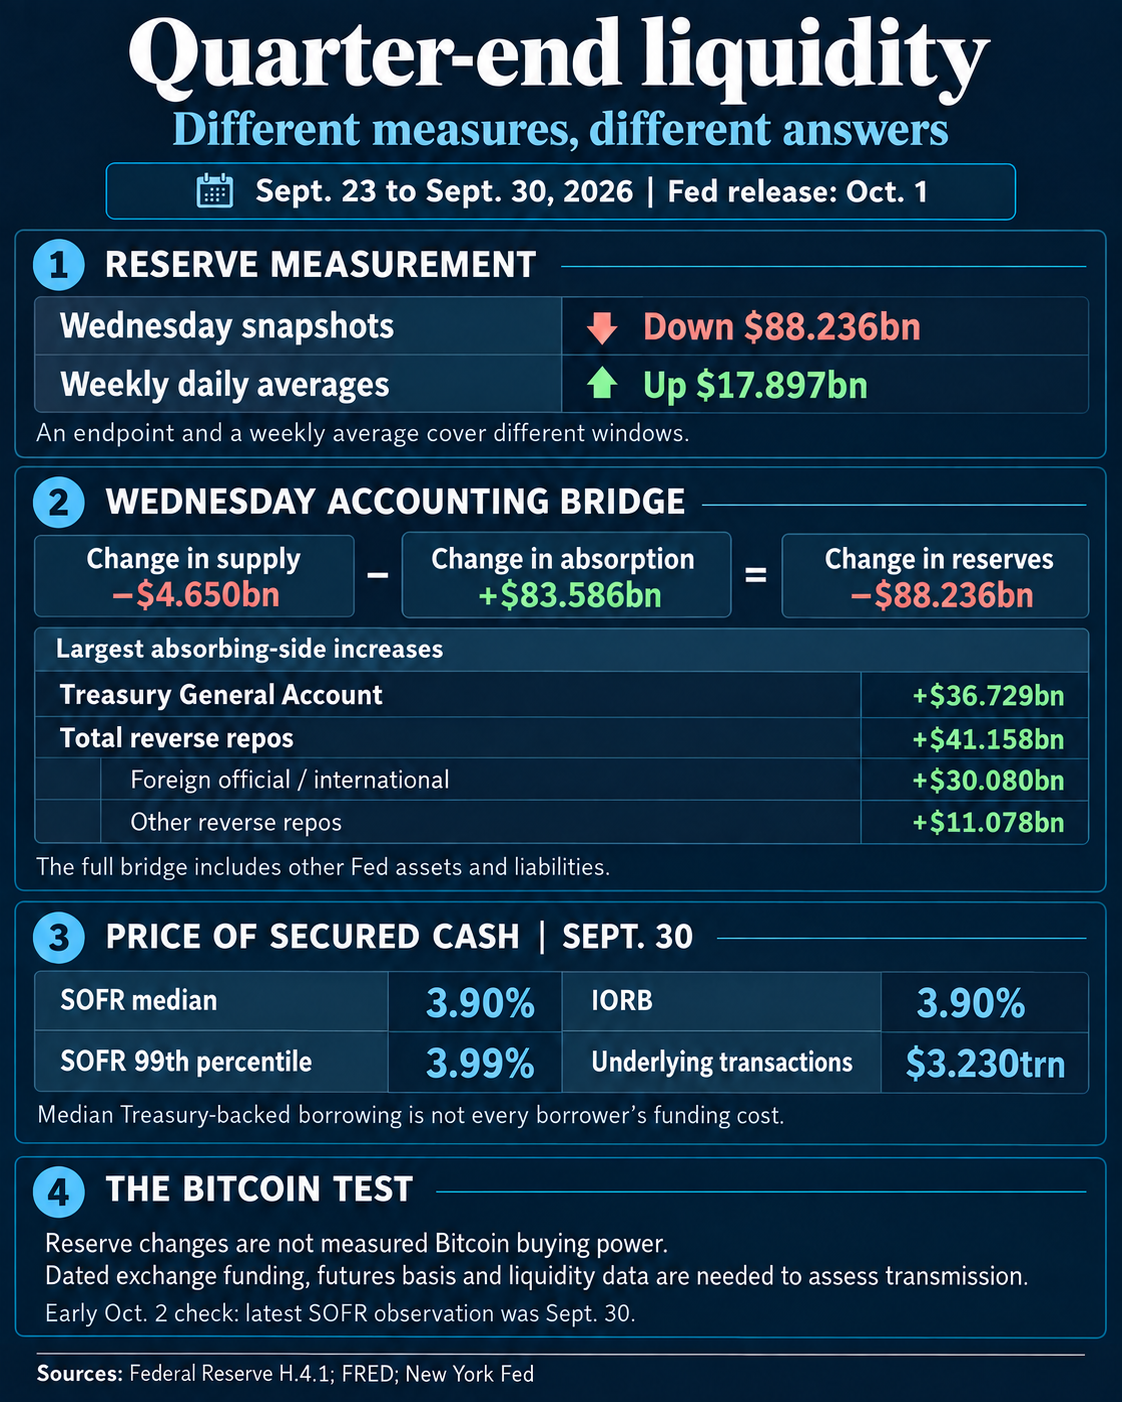
Bitcoin’s quarter-end liquidity signal changes direction depending on which reserve measure is used. Federal Reserve data released Oct. 1 show bank reserves falling $88.236 billion between Sept. 23 and Sept. 30 Wednesday snapshots, while their weekly average rose $17.897 billion.
Reserves are balances banks hold at the Federal Reserve to make and receive payments. Their level matters for dollar financing, but a reserve chart alone cannot establish whether pressure reached Bitcoin. The balance-sheet decline is largely accounted for by Treasury cash and reverse repos, predominantly involving foreign official accounts. September 30’s median cost of Treasury-backed overnight borrowing was 3.90%, within the range of the five latest observed readings.
September’s quarter-end therefore offers a test of the measurements behind a liquidity thesis. An endpoint balance, an average balance and a funding price describe different aspects of the system. Treating them as interchangeable can turn the same week into opposing market signals.
The Wednesday reserve series fell from $2.969922 trillion on Sept. 23 to $2.881686 trillion on Sept. 30. The weekly-average series rose from $2.930193 trillion to $2.948090 trillion for the weeks ending on those dates.
Both readings come from the Fed’s H.4.1 release. One compares balances on two Wednesdays; the other compares averages of daily figures across two weeks. A lower final observation can coexist with a higher average, because the readings cover different time windows.
| Measure | Sept. 23 | Sept. 30 | Change |
|---|---|---|---|
| Wednesday reserve balances | $2.969922 trillion | $2.881686 trillion | Down $88.236 billion |
| Weekly-average reserve balances | $2.930193 trillion | $2.948090 trillion | Up $17.897 billion |
The Treasury General Account, the government’s account at the Fed, illustrates the same problem. Its Wednesday balance rose $36.729 billion to $984.046 billion. Its weekly average fell $28.410 billion to $948.674 billion.
Mixing the Wednesday reserve decline with the average Treasury decline would combine observations from different windows. It could obscure the very cash movement an investor is trying to explain. A chart labeled “weekly” still needs a second question: is each point a weekly average or a balance observed once a week?
The endpoint captures the quarter-end position. The average describes the level across the week. Neither provides a complete daily path or proves how persistent the final-day position will be. For a Bitcoin liquidity argument, choosing the window changes the evidence before any price forecast enters the discussion.
Where the Wednesday reserve decline went
The Oct. 1 H.4.1 release and previous release provide an accounting bridge. Between the two Wednesday observations, factors supplying reserves fell $4.650 billion, while factors absorbing funds outside reserve balances rose $83.586 billion. Together, those changes reconcile the $88.236 billion reserve decline.
Treasury cash was a major part of the absorbing side. Total reverse repos were another: they rose $41.158 billion to $361.883 billion. But most of that reverse-repo balance belonged to foreign official and international accounts, which increased $30.080 billion to $350.344 billion. The remaining “others” category increased $11.078 billion to $11.539 billion.
Calling the whole $361.883 billion domestic overnight reverse-repo usage would misidentify both the counterparties and the size of that facility. The distinction also matters for comparisons with charts that subtract a domestic reverse-repo series from Fed assets: those charts do not represent every liability moving in this release.
Beyond Treasury cash and reverse repos, currency in circulation increased $373 million, other non-reserve deposits rose $3.001 billion, and other liabilities and capital increased $2.317 billion. A separate Treasury cash-holdings line rose $8 million. These smaller absorbing-side changes complete the $83.586 billion increase, with foreign official deposits and the remaining deposit categories unchanged.
The supplying side moved too. Outright securities declined $6.491 billion, partly offset by $1.199 billion more repo agreements and $2.493 billion more loans. Those selected changes sit inside the full accounting bridge; they are not its complete total. Treasury securities actually rose $5.829 billion while mortgage-backed securities fell $12.320 billion, so the holdings did not move uniformly. The separately presented consolidated balance sheet reported a $4.673 billion decline in total Fed assets, a different measure from the $4.650 billion fall in reserve-supplying factors.
The Fed’s explanation of its liabilities sets out the mechanism. Receipts into the Treasury account can drain bank reserves, while Treasury spending can return balances to banks, all else equal. Other Fed assets and liabilities can offset or reinforce those transfers. Gross bond issuance is therefore not an equal-sized withdrawal from reserves, and the observed TGA increase cannot all be assigned to a particular auction from these figures alone.
For the same reason, $88.236 billion less in bank reserves is not a measured $88.236 billion loss of money available to buy Bitcoin. The accounts establish where balances changed; a crypto-market effect requires evidence of a financing channel.
Funding prices give a different test
At the early Oct. 2 check, the New York Fed’s latest SOFR observation still covered Sept. 30. It was 3.90%, matching the Fed’s interest on reserve balances, or IORB. The five latest observed SOFR medians ranged from 3.88% to 3.90%.
September 30’s 99th-percentile rate was 3.99%, with $3.230 trillion of underlying transactions. SOFR rose from 3.88% the previous day, but the quarter-end median was also the same as on Sept. 25 and Sept. 28. That shows limited movement in the median, while leaving open strain in parts of the market or among borrowers with different access to cash.
SOFR measures overnight borrowing against Treasury securities and is calculated as a volume-weighted median. It describes the middle of the observed dollar volume, not the rate every borrower could obtain. A 99th percentile below 4% likewise does not establish that every transaction occurred below that level.
Nor were Fed lending operations absent. H.4.1 reported $1.2 billion of outstanding repo agreements on Sept. 30. The daily repo-purchase series separately recorded $1.2 billion that day and zero purchases on Oct. 1. An outstanding balance and a daily operation amount remain distinct measures, even when their values match.
Access is another reason to look beyond the median. The standing repo terms specify a 4.00% rate, two daily operation windows and a $40 billion proposition limit per eligible counterparty, per eligible security type, per operation. Access depends on counterparty and collateral eligibility, so the backstop’s terms cannot prove every market participant had ready access to cash.
October 1 supplied a narrower follow-up: domestic overnight reverse-repo usage fell from $11.539 billion to $350 million. That indicates the domestic facility increase unwound sharply. It does not measure an aggregate reserve rebound or show that the foreign official pool did the same. October 1 SOFR was not yet available in the early Oct. 2 snapshot.
What would establish pressure reaching Bitcoin?
CryptoSlate’s Sept. 28 settlement preview posed a conditional test of repo and Bitcoin funding after settlement, following its Sept. 21 tax-date coverage of falling bank balances alongside orderly repo. The new reserve comparison adds a reason to examine the measure itself before turning that test into a market conclusion.
Evidence of a dollar-funding squeeze would be stronger if borrowing costs remained elevated relative to the Fed’s settings across subsequent observations, with pressure visible beyond one median. Facility usage and access conditions would help distinguish a temporary quarter-end adjustment from continuing financing strain.
A Bitcoin transmission claim needs another link: dated exchange or instrument-level funding, futures-basis or liquidity observations over a comparable window. Changes in market depth, credit availability or positioning could corroborate that link. Even simultaneous Bitcoin weakness and higher repo rates would leave causation unresolved.
The current reserve and SOFR figures establish neither a Bitcoin financing shock nor its absence. They establish something more specific: the Wednesday reserve decline reconciles with changes elsewhere in the Fed’s accounts, the weekly average moved in the opposite direction, and the latest observed secured-cash median remained at IORB. Subsequent funding prices and direct Bitcoin financing data can strengthen or weaken the case that the quarter-end balance-sheet movement became a sustained squeeze.
Source: CryptoSlate