



FILTERED RESULTS
FILTERS
MCap $2.8T -0.9%24h Vol $56.8T +63751%Fear & Greed 62/100Alts Index 45/100
BTC.D 59.9% +0.6%Stable.D 9.5% +0.1%ETH.D 10.9% +0.1%Others.D 19.7% -0.8%
WAL$0.0507+31.59%•Q$0.0496+27.97%•BTW$2.347+23.28%•AI$0.1028+20.01%•PRL$1.905+14.73%•DEEP$0.0234+10.42%•CASHCAT$0.1127+8.62%•PONS$0.3278+7.76%•TRAC$0.4421+5.02%•XMR$553.16+4.34%•
S$0.0558-22.04%•W$0.0154-16.76%•STRK$0.0786-11.43%•SYRUP$0.2229-10.66%•CAP$0.0831-10.36%•TIA$0.5404-10.17%•ETHFI$0.6397-8.44%•KCS$7.240-8.11%•RAY$1.924-7.92%•CC$0.1173-7.75%•
•
·
·
FILTERED RESULTS
Ripple News Today: Ripple Makes New Push Into Traditional Stock Markets
HEX founder Richard Heart arrested in Istanbul
‘Bunker mode’ won’t protect your crypto, critics say
EQX to Launch 11 Tokenized Stock and ETF Markets on Hyperliquid
Standard Chartered has pushed back its $2 trillion stablecoin market cap forecast to
US stocks open, Nasdaq down 0.75%
K33: Strategy's preferred-stock financing for Bitcoin purchases is costly, with annualized dividend expenses reaching $725 million
NVIDIA Will Provide the United Kingdom With $250 Million for AI Safety Research
Qivalis Secures Dutch Approval for Euro Stablecoin Backed by 37 European Banks
Oct 14 Update:#Bitcoin ETFs:1D NetFlow: +2,033 $BTC(+$167.62M)7D NetFlow: -7,502...
Polygon Completes Coinme Acquisition, Turns Open Money Stack Into US-Regulated Payments...
Netflix plans to cut around 1,000 jobs representing 6% of its workforce...
DriveWealth to use Ripple's RLUSD for stablecoin settlement, cross-border payments
Polygon Labs Finalizes Acquisition of Coinme
Evernorth Partners with Ripple, Kraken, Coinbase, and BitGo for XRP Yield Initiatives
Is Bitcoin Going Down To $75,000? Why Saylor’s Cost Basis Is The Level To Watch
Brooklyn DA Cracks Global Crypto Scam Network in Major Bust
Strive CEO Matt Cole posted that the company acquired an additional 2,822 BTC for approximately...
Illinois Crypto Tax Case Fast-Tracked as State Pauses 0.2% Levy Until July 2027
NEAR Protocol Faces a Major Test as Price Approaches $6 – Can NEAR Price Break the Resistance?
Kraken Parent Payward Acquires Saldo Bank to Expand Crypto Banking in Europe
HEX and Pulsechain Founder Richard Heart Reportedly Detained in Istanbul Police Raid Linked to...
U.S. 30-Year Treasury Yield Breaks Above 5.62%, Up 5.8 Basis Points on the Day
Brokerage service provider DriveWealth to use Ripple's RLUSD for stablecoin settlement and cross-border payments
Kraken parent Payward to become first crypto firm to buy a EU bank as it expands into deposits, lending
Canada crypto remittances to Asian countries surge 141% to $2.36B: Chainalysis
Polygon Labs completes Coinme acquisition, bringing regulated payments coverage across 48 US states
Bitcoin Price Plunges as September CPI Comes Out Higher Than Expected
US Inflation Rate Rises to 3.7% Driven by Gasoline Prices
US September CPI Rises to 3.7%, Core Inflation Beats Forecasts
Polygon Labs Completes Acquisition of Coinme, Open Money Stack Becomes a Regulated U.S. Payments Platform
Solana Bets on Near-Instant Finality as Alpenglow Goes Live October 21
U.S. September CPI Broadly Exceeds Expectations, Annual Rate Rises to 3.7%, Highest Since MayU.S....
HEX Founder Richard Heart Reportedly Arrested in Istanbul Dawn Police Raid
Bitway’s BTW Coin Price Climbs Nearly 36% in 24 Hours: Here is Why
Bitcoin’s next difficulty rise could leave some rigs earning less than their power bill
Qivalis receives EMI authorization from Dutch central bank for euro stablecoin
Bitcoin treasury firm Strive $ASST acquired an additional 2,822 bitcoin:native for
U.S. Inflation Rises to 3.7% Amid Ongoing Energy Price Pressures
U.S. Short-Term Interest Rate Futures Decline Amid Increased Rate Hike Expectations
U.S. Core CPI Increases to 2.6% Year-on-Year in September
U.S. Consumer Price Index Rises to 3.7% in September
Smarter Web’s Bitcoin-Backed MORE Shares Debut on LSE at 12% Dividend
Market increases bets on Fed rate hike in October
NEW: Tether has launched a 254-million-parameter AI speech recognition model that transcribes audio
Gemini 4 Argon: What Google’s New Flagship Can Do
An Economist Explained why Bitcoin’s Fixed Supply Is Its Main Advantage
US core CPI annual rate hits highest since June
U.S. September CPI comes in hot, sending bitcoin sharply lower
Bitcoin Price Caught Between Bullish Averages and $84K Resistance
US inflation rises to 3.7% in September from 3.4% in August exceeding...
US inflation rises to 3.7%....
ETH falls below $2,500, down 0.70% on the day
Most Blockchains Will Disappear: An Expert Highlighted Key Metrics for Network Survival
Strive(@Strive) bought another 2,822 $BTC ($235M) at $83,266 over the past 2 days.In less than 2...
Evernorth Partners with Major Crypto Firms to Deploy $648 Million XRP Treasury
Security researcher warns hardware wallet users may not detect supply-chain tampering, citing...
Strive purchased another 2822 bitcoin:native for $235 million bringing...
Strive adds 2,822 BTC, bringing total holdings to 35,595 BTC
EU enterprises weigh agentic AI as adoption broadens
Strive Expands Bitcoin Holdings by 2,822 BTC at $83,266 Each
Morning Minute: Move Over, Saylor, There’s a New Top Buyer in Town
XRP treasury company Evernorth plans to deploy its $648 million XRP reserve into business operations
Fidelity, Blackrock Lead $176M Bitcoin ETF Rebound
DIFC Courts Implement Avalanche Blockchain for Document Verification
REMINDER: 30 minutes (08:30 ET) remain until the release of CPI....
Apple Stock Hits Record High as HomeView Launch Puts AI Growth Strategy in Focus
Bybit Kazakhstan Allowed Cryptoasset Investments to Count toward Obtaining Tax Residency in Kazakhstan
Bitway (BTW) Rockets 250% in a Month: Perfect Time to Short?
Ethereum Price Analysis: What’s the Worst-Case Scenario if ETH Loses $2.5K Support?


Ethereum is stabilizing around $2.5K after another sharp test of demand near $2.4K. Buyers have defended the recent lows, but the recovery remains below key resistance, leaving the market caught between a potential base and another leg lower.
Ethereum Price Analysis: The Daily Chart
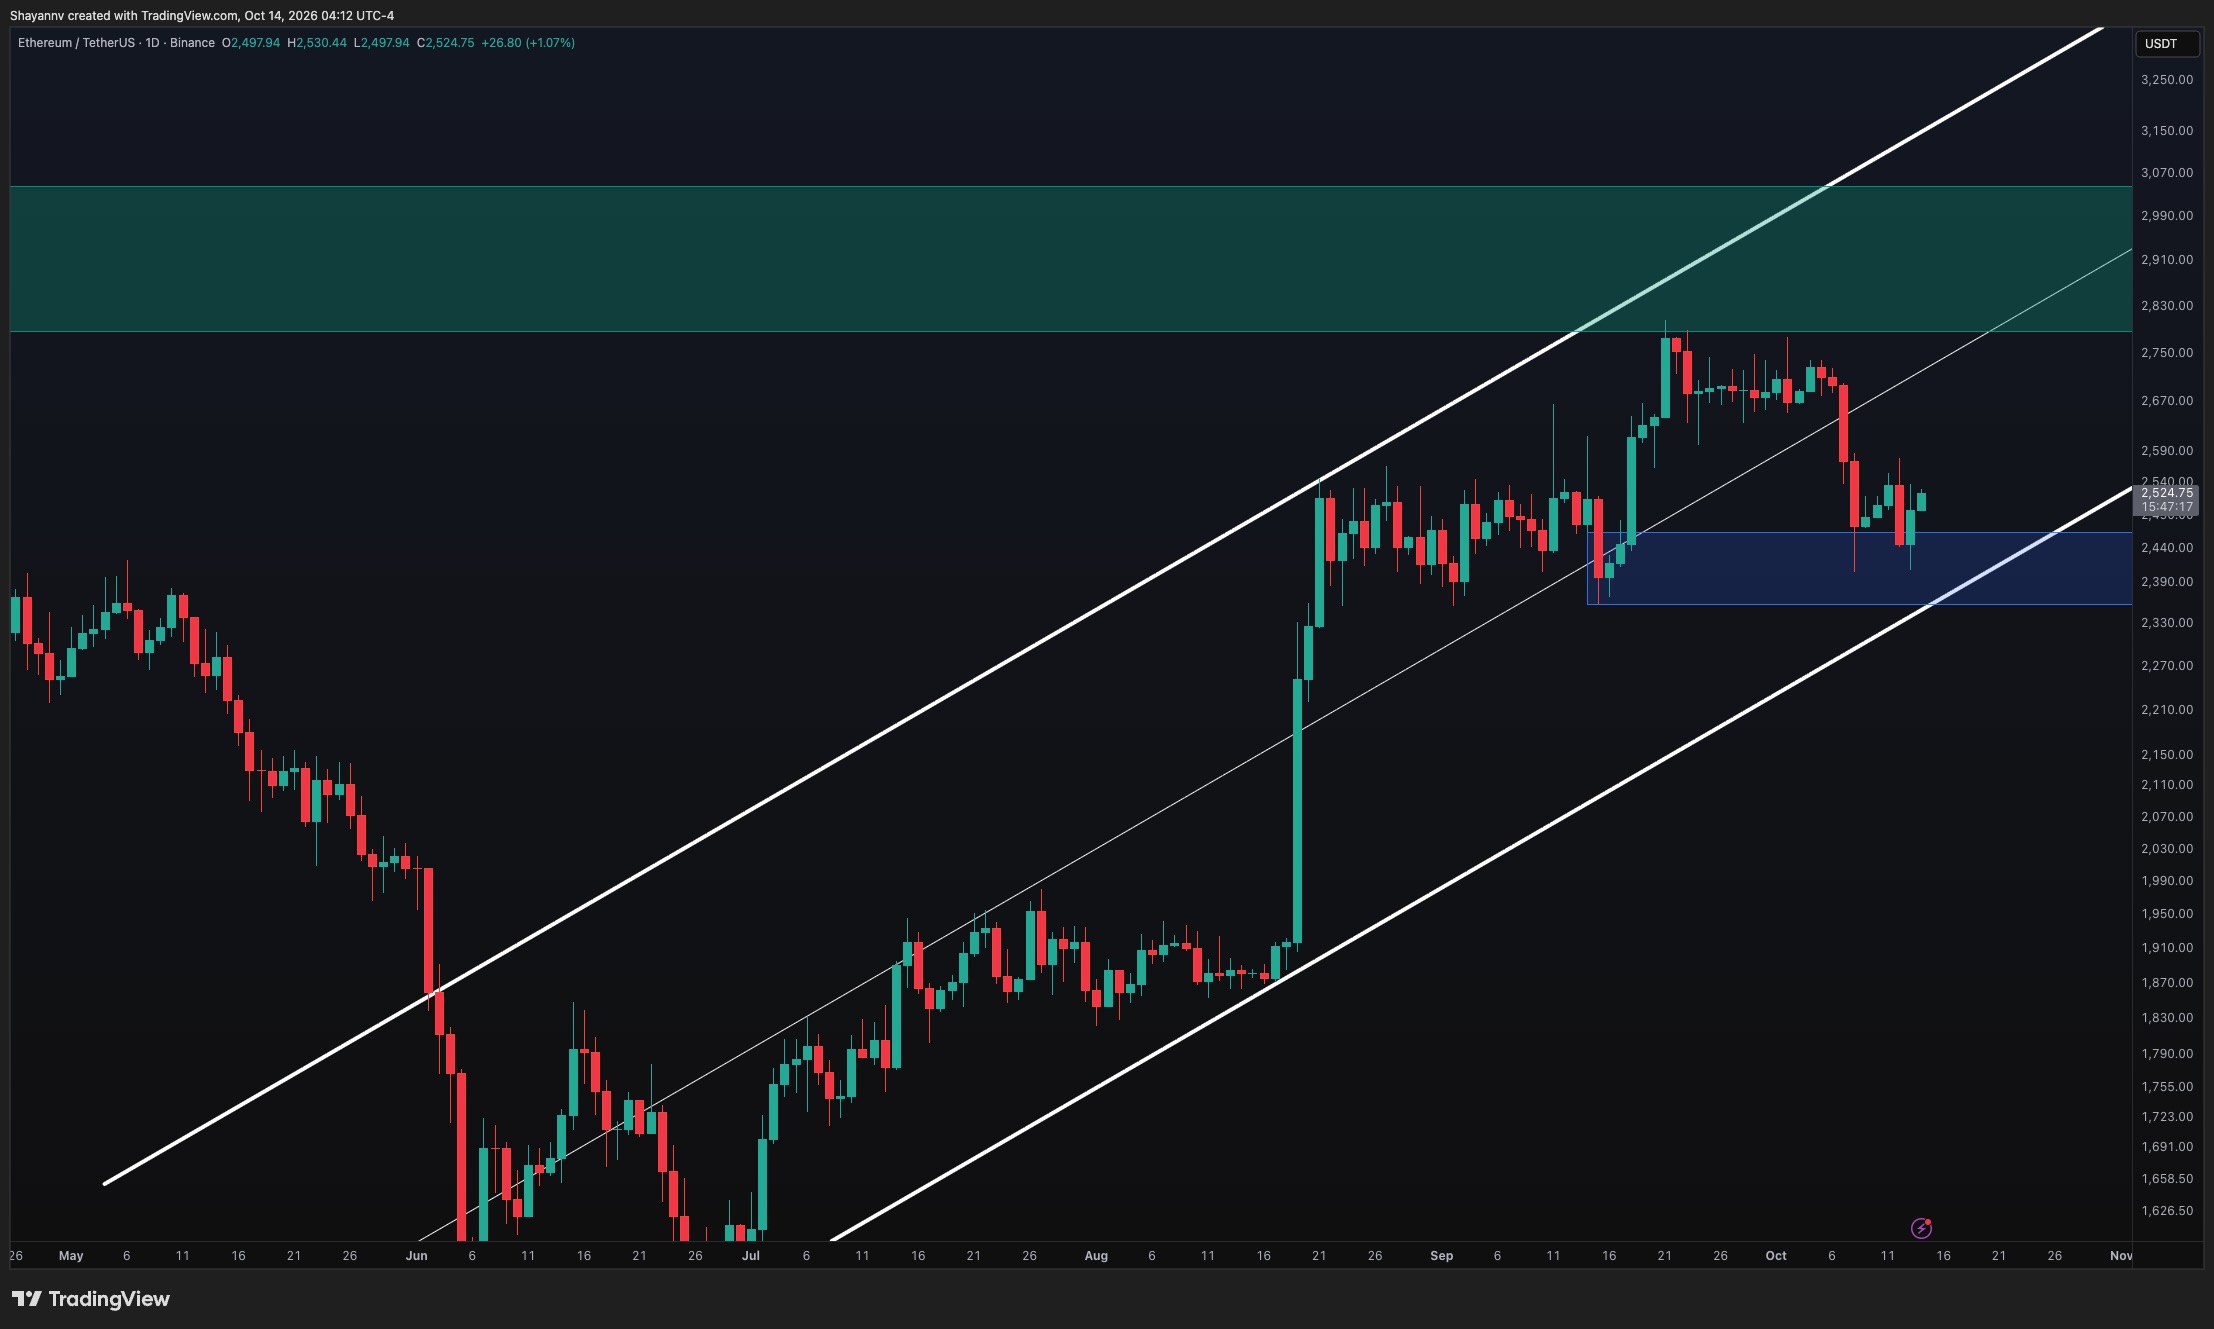
On the daily timeframe, Ethereum remains within its broader ascending channel despite the recent correction. The decline from approximately $2.8K pushed the price below the channel’s midpoint and into the highlighted $2.36K–$2.46K demand zone. Two pronounced lower wicks into this region suggest buyers are responding to selling pressure, though subsequent rebounds have remained relatively modest.
The latest recovery toward $2.52K keeps ETH above demand, but a move through the recent rebound highs around $2.56K–$2.58K is needed to demonstrate improving momentum. Beyond that, the former consolidation around $2.67K–$2.75K represents an important resistance area. Reclaiming it could support another challenge of the broader $2.79K–$3.05K supply zone.
Conversely, renewed weakness would bring the $2.36K–$2.46K demand zone back into focus. This area overlaps with the channel’s rising lower boundary, making it a significant support confluence. A sustained breakdown beneath both would weaken the broader recovery structure and increase the risk of a deeper correction toward $2.3K and $2.2K.
ETH/USDT 4-Hour Chart
The 4-hour chart highlights two sharp declines toward the rising lower trendline around $2.4K–$2.42K, each followed by a rebound. These reactions suggest that buyers are defending the lower portion of the structure, but the latest recovery has yet to clear the previous rebound high near $2.58K.
In the immediate term, ETH is consolidating around $2.5K–$2.53K. A sustained break above this narrow range could bring the $2.56K–$2.58K resistance area into play. Clearing that barrier would strengthen the base-building scenario and open the way toward the marked $2.68K–$2.74K supply zone, where the earlier consolidation broke down.
On the downside, losing $2.48K would expose the upper boundary of demand near $2.46K and potentially trigger another test of the rising trendline around $2.41K. Repeated tests make the response at this support increasingly important. A decisive loss of the trendline and the $2.36K demand boundary would undermine the current stabilization attempt.

Sentiment Analysis
The two-week Binance ETH/USDT liquidation heatmap shows substantial estimated liquidation concentrations above the current price. The nearest prominent overhead band sits around $2.58K–$2.6K, followed by another strong cluster near $2.63K–$2.65K. Additional concentrations remain higher around $2.74K–$2.8K.
The nearby $2.58K–$2.6K cluster aligns with the recent rebound high, making this region relevant to both price structure and leveraged positioning. A sustained advance through it could trigger short liquidations and accelerate the recovery toward the next overhead pool. However, reaching these levels would not itself confirm a lasting bullish reversal.
Below price, estimated liquidation bands remain around $2.47K–$2.49K and the broader $2.37K–$2.4K region. Another loss of nearby support could expose these concentrations and amplify selling through long liquidations. The heatmap therefore highlights potential volatility on both sides, with a break above $2.58K or renewed weakness beneath $2.48K likely to clarify the immediate direction.

Source: CryptoPotato