



FILTERED RESULTS
FILTERS
•
·
·
FILTERED RESULTS
Wall Street Watch: Boeing (BA), GameStop, Robinhood, and Micron Lead Wednesday’s Trading Action
Nvidia (NVDA) Stock Gains as Trump Endorses AI Industry Self-Regulation
The Morning Risk Report: Trump Defends Light-Touch AI Strategy After Industry Sounds Alarms
Xi Calls China’s Economy Resilient, Urges Efforts to Reach Goals
Andy Burnham says rejoining EU an option for UK
Burundi to take third-country deportees from US
What Evan Gershkovich wants you to know about his imprisonment in Russia
Coal Buyers Resist High Prices Despite Costly Alternatives
Holiday Retail Sales Projected to Exceed $1 Trillion Amid Inflation
U.S. Pension Funds Expected to Sell $33 Billion in Stocks
GE Vernova (GEV) Stock Climbs Following NRC Approval for Tennessee Nuclear Reactor
Polish Inflation Spirals Beyond Central Bank Target Range
US Mortgage Rates Rise to an Almost Three-Year High of 7.3%
Deutsche Bank Plans Risk Trade Tied to $2 Billion in Fund Loans
UAE-Israel flight diverted after ‘incident’ and 20,000ft drop
Russia extends diesel export ban
Viruses run rampant across Havana as water, power fails
J.P. Morgan favors European platforms on growth, sees UK backdrop as drag
Deutsche Bank sees mixed third quarter for transportation stocks
Robinhood Expands AI Trading Tools at HOOD Summit
U.S. Mortgage Rates Reach 7.30%, Impacting Housing Affordability
Repunte bursátil de Argentina se limita a empresas petroleras
PCE Data Could Spark Improved Bonds Sentiment: Manulife
Iraq Deepens October Crude Price Discounts to as Much as $37
Trump's Meeting with Tech Leaders Fails to Resolve AI Safety Concerns
US Mortgage Rates Increase to an Almost Three-Year High of 7.3%
UBS Highlights Potential Benefits of Higher Interest Rates for Hedge Funds
China’s A-share exporters face rising currency losses in H1 2026 says UBS
UBS sees macro beta shifts in Japan stock market positioning
Syria to boost agriculture with $175m from World Bank
Opec+ likely to keep output targets steady at Sunday meeting
Sibos 2026: Financial Leaders Discuss ISO 20022 Implementation Challenges
China Delivers Latest Drip Feed of Stimulus to Keep GDP Target Floor in Reach
Legal challenges to Trump’s tariffs
Bond Yields Not High Yet: Pedersen on Inflation Risks
Argentina Stock Prices: Rally Narrows to Oil Companies (YPF, VIST)
Trump’s coal drive plays into Beijing’s hands
Morning Bid: October doubts
Hormel Foods to buy Brakebush in deal valued at $1.06 billion
Elf Beauty stock gains on strong sales data from Canaccord tracker
Stocks and Bonds Pause Ahead of US Data, Micron: Markets Wrap
Iran Increases Alert Level at 46 Infrastructure Facilities
Oracle Expands Financial Crime and Compliance Management Portfolio with New AI Tools
Crude Oil Prices Decline Amid US-Iran Negotiations and SPR Release
Flydubai Flight FZ1081 Diverts Back to Dubai
Apple (AAPL) Stock Dips 3% Despite Strong iPhone 18 Pro Performance in China
Novo Nordisk (NVO) Stock: Oral Wegovy Users Shed 4% Body Weight in OCTANE Study
US Dollar Maintains Strength Near Two-Month Peak Ahead of Critical Inflation Report
Dubai-Israel Flight Makes Saudi Emergency Landing After Incident
UAE-Israel flight diverted after distress signal and 20,000ft drop
European Markets Surge on Tech Rally Fueled by Trump’s AI Infrastructure Push
DeepSeek and Huawei Target a Key Source of Nvidia’s A.I. Dominance
ABN AMRO Bank Extends Partnership with Infosys for AI Transformation
Equity positioning stays overweight, but summer extremes have eased: Barclays
GEO and SWBI: Decoding Five Election Cycles of Wall Street’s Most Politically Wire
Japan economic panel members underline BOJ independence
Inflation jumps across euro zone, raising pressure on ECB to hike
Zambia Bucks Global Trend, Delivers Deepest Rate Cut in 15 Years
Apple to Launch New Smart-Home Products on October 13
UK FCA Begins Accepting Applications for Crypto Firm Authorization
Needham Maintains Buy Rating on SpaceX with $250 Price Target
Why is Yiren Digital stock climbing today?
UK regulator warns Brink’s takeover could hurt ATM competition
Ireland reports retail sales growth in August
Russia warns NATO over Kaliningrad nuclear threat
Goodhart and Pradhan on the end of monetary independence
Sterling Rises on Strong U.K. Data, Prospect of Fiscal Discipline And Improved EU-U.K. Ties
Payhawk Expands European Presence with New Offices in Stockholm and Warsaw
Bank of England Warns of Potential AI Market Correction
Solana (SOL) ETFs Record Highest Weekly Inflows Since November 2024 – Price Eyes $150


Key Highlights
- SOL maintains its position around $120, staying above critical support zones.
- American spot Solana ETFs recorded their 11th consecutive week of positive inflows.
- Market analyst Ali Charts projects a $150 price target for SOL via X platform.
- ETF inflows reached $188.21 million for the week, marking a 10-month peak.
- The blockchain platform dominated tokenized commodity trading volumes for the first time historically.
The price of Solana hovered around the $120 mark on Tuesday, maintaining stability above the $116 support threshold. The digital asset experienced a slight retreat following a test of the $125 level during the previous week.
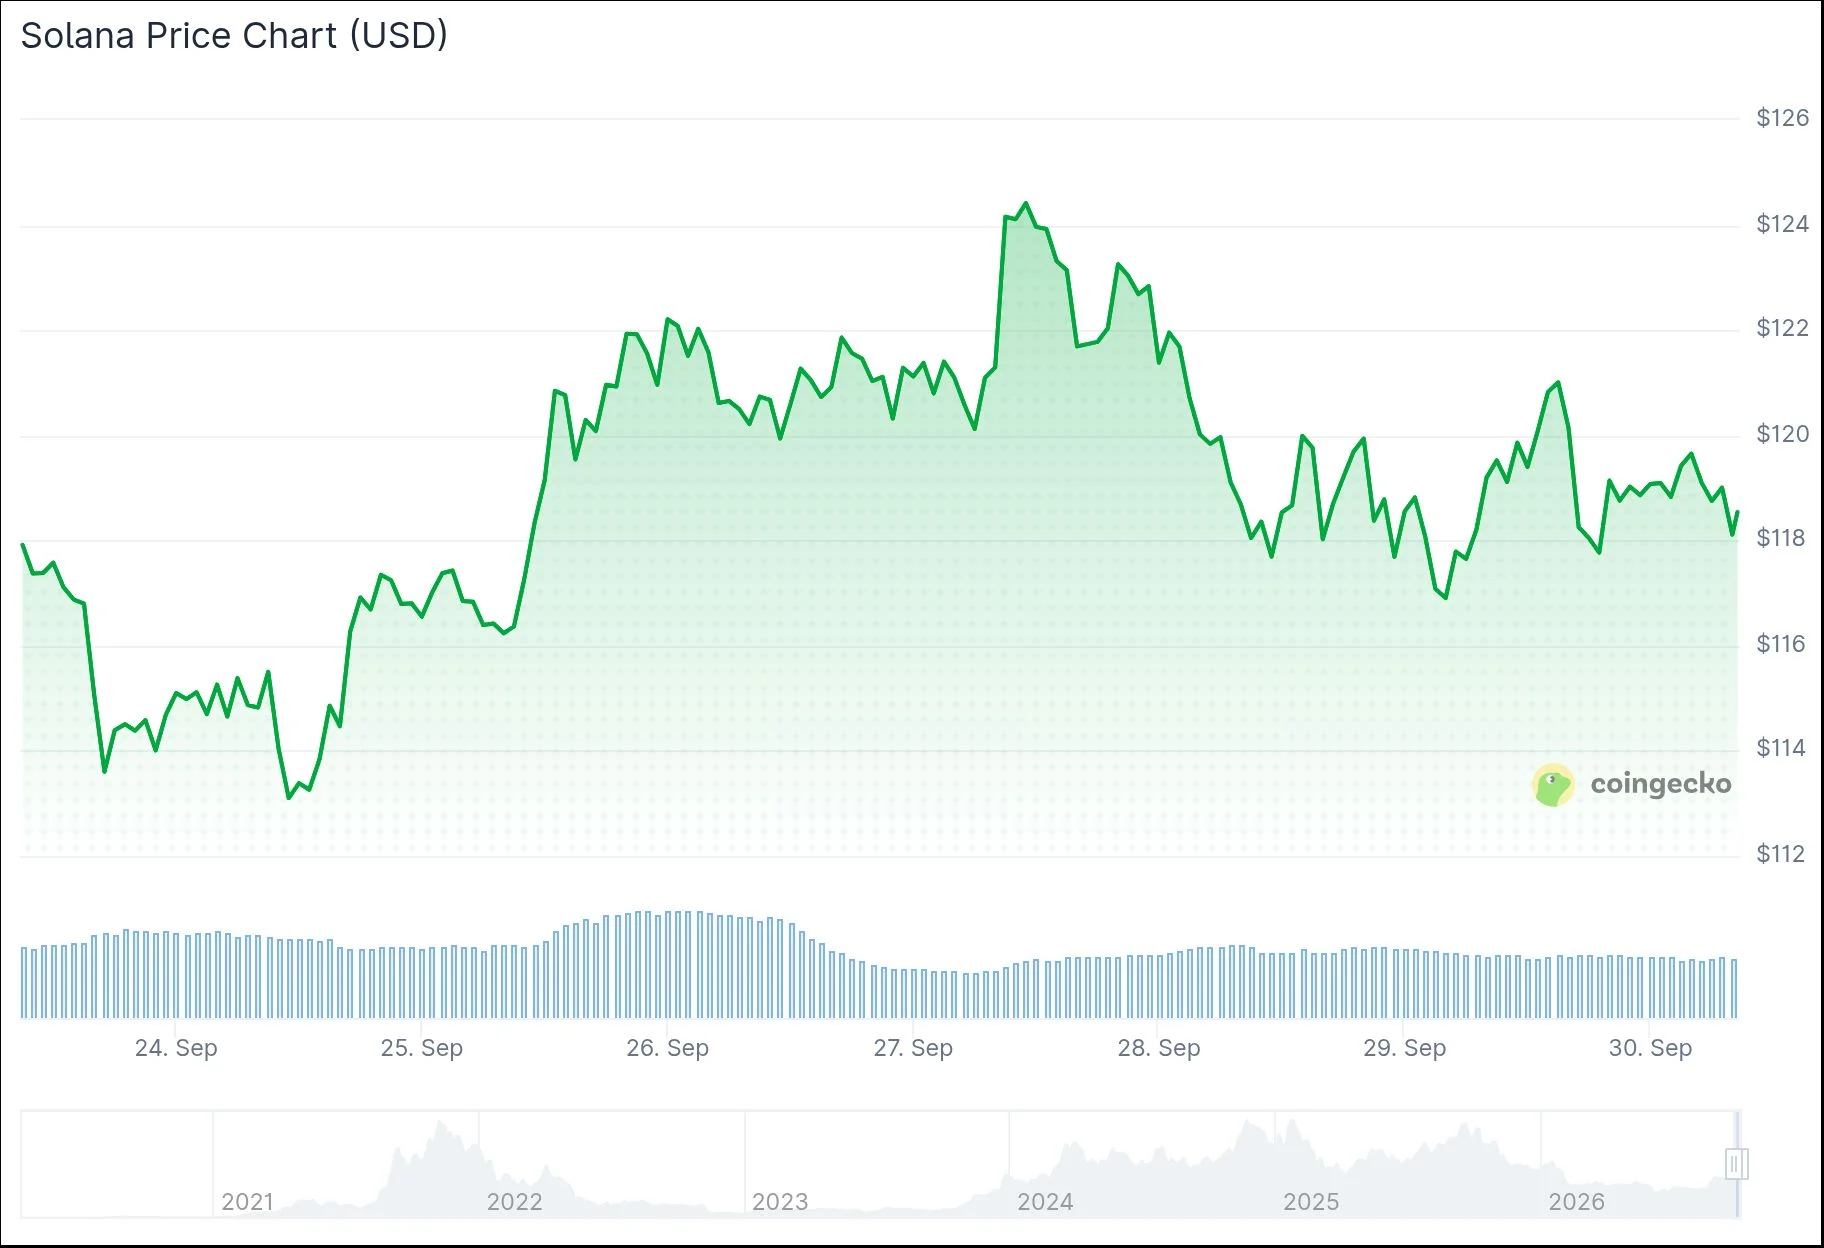
This price action occurred against a backdrop of overall cryptocurrency market strength, with total market capitalization climbing 1.11% to reach $2.9 trillion over a 24-hour period. Bitcoin maintained its position near $84,000, while Ethereum continued trading above the $2,700 threshold.
The streak of positive inflows into US-based spot Solana ETFs expanded to an 11th consecutive week. Market analyst Ali Charts reported that these investment vehicles have accumulated approximately 4.37 million SOL tokens beginning July 13.
In data shared via X, Charts indicated that the ETF holdings currently represent approximately $450 million in SOL value. “Given the persistent institutional accumulation of Solana, I’m monitoring for potential upward movement toward the $150 level,” he stated, establishing $150 as his projected resistance target.
The analyst’s calculation of 11 uninterrupted weeks extends through September 25. At the time of his post, the ongoing trading week remained in progress.
Weekly ETF Capital Influx Hits Ten-Month Record
American spot Solana exchange-traded funds attracted $188.21 million during the seven-day period concluding September 27. SolanaFloor characterized this as the most robust weekly performance recorded in ten months.
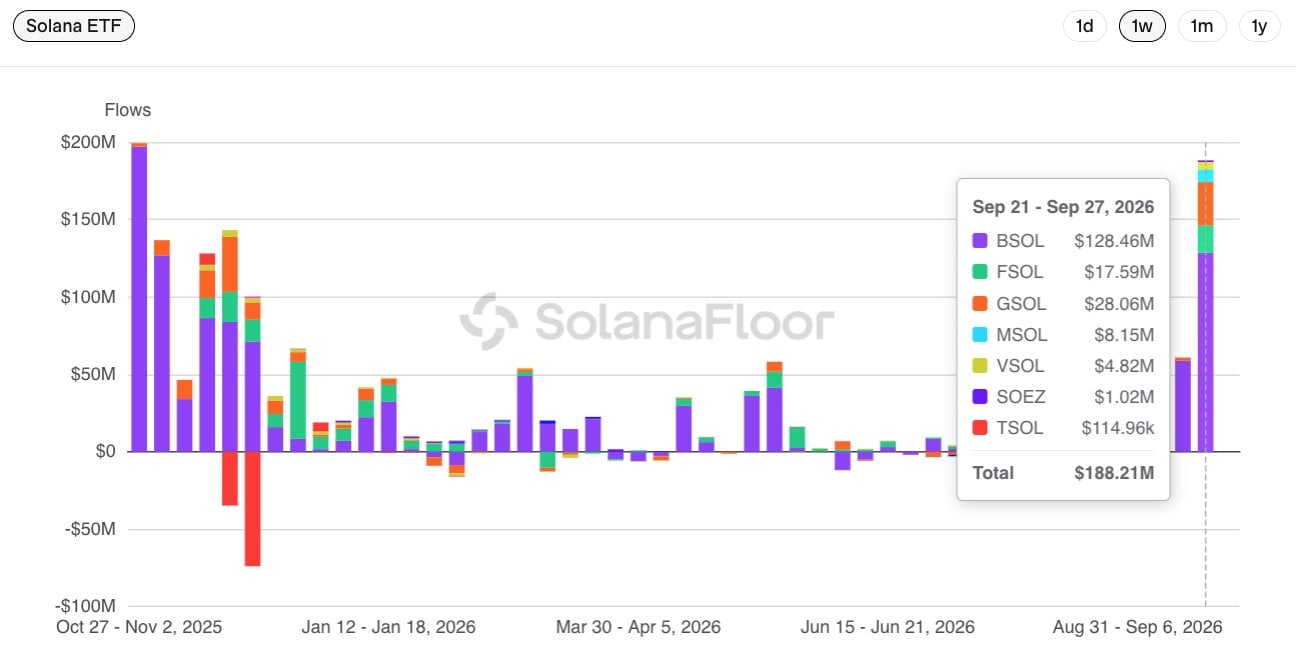
Bitwise’s BSOL product dominated the inflows with $128.46 million. Grayscale’s GSOL contributed $28.06 million to the total, while Fidelity’s FSOL accounted for $17.59 million in new investments.
According to SoSoValue tracking data, an additional $12.70 million flowed into these funds on September 28. The aggregate net inflows spanning all Solana ETF products reached $1.62 billion, pushing total net assets under management to $1.93 billion.
This sum constitutes 2.76% of Solana’s overall market capitalization. In related developments, DeFi Development Corp disclosed that it increased its position by approximately 47,706 SOL tokens since September 21, elevating its total holdings to roughly 2.54 million SOL.
Network Dominates Tokenized Commodity Transaction Volume
Decentralized exchanges operating on the Solana blockchain facilitated $91.1 million in tokenized commodities transactions during the September 21-27 timeframe. This volume represented 28% of the $322.7 million total market activity, as documented by Blockworks research.
Robinhood Chain secured the second position with $81.3 million in volume, capturing roughly 25% of market share. Notably, Solana’s portion increased significantly from just 5% measured four weeks prior.
Canton Network followed in third place with $67.4 million in weekly transactions. Ethereum processed $62.6 million during the identical timeframe.
The stablecoin supply residing on the Solana network totaled $17.3 billion as of September 25, based on official network statistics. However, DefiLlama’s Tuesday assessment placed the figure somewhat lower at approximately $16.37 billion.
Technical indicators on the four-hour chart showed the RSI registering 55.99, suggesting strengthening momentum. The MACD line continued trading beneath its signal line, while the histogram displayed negative values.
Market participants are monitoring $120 as the primary support threshold, with additional support zones identified at $115 and $110 beneath current levels. A successful breach above $125 would bring $130 into focus, with $150 serving as the upper target that analysts are currently tracking.
Source: Parameter